“A COMPARATIVE ANALYSIS OF PROFITABILITY OF SELECTED DIAMOND COMPANIES IN INDIA”
Abstract : The present paper aims to comparative analysis the Profitability of the selected diamond companies by making use of Profitability ratios such Gross profit ratio, Net profit ratio, Expenses or Operating ratio Return on fixed Assets Ratio, Return on Shareholders’ Funds Ratio, Return on Capital Employed Ratio for the time spanning from 2004-2014. Short term creditors are mainly interested in the profitability position of the firms to know the promptness of company to meet its current liabilities. The result shows that among the nine selected diamond companies i.e. Asian Star Co Ltd, Goenka Diamond, Rajesh Exports, Gitanjali Gems, Classic Diamonds, Winsome Diamond And Jewellery, Shrenuj And Company, Goldiam International, C. Mahendra Exports
Key words:
Gross profit ratio, Net profit ratio, Expenses or Operating ratio, Return on fixed Assets Ratio, Return on Shareholders’ Funds Ratio, and Return on Capital Employed Ratio, Diamond Company, profitability
India’s gem and jewellery industry is a bright star of the economy, and one of the important foundations of the country’s export - led growth. The Industry valued at US$ 59 billion in the financial year 2013–14, is one of the leading growth sectors of India’s export led economy and leading foreign exchange earner accounting for 18 % of the total Indian exports during the last financial year.
Profitability is an indication of the efficiency with which the operations of the business are carried out. The profitability of a firm can be measured by its profitability ratios.
The amount and rate of profits earned depend upon the quantum of investment committed, so the profitability ratios can be calculated on the basis of their sales or investment. Owners are interested to know the profitability as it indicates the return which they can get on their investment. The profitability ratios in relation to sales are
(1) Gross profit ratio, (2) Net profit ratio, (3) Expenses or Operating ratio, (4) Return on fixed Assets Ratio, (5) Return on Shareholders’ Funds Ratio, (6) Return on Capital Employed Ratio
The profitability in relation to sales can be used to assess the ability of the firm’s management to control the various expenses involved in generating sales.
Smith (1980)conducted a study on Profitability and Liquidity and suggested that working capital management directly influence risk and profitability of a firm. Hence it can be inferred that effective working capital management can increase the financial strength of a business.
Amandeep (1991), in her thesis titled, “Profits and Profitability of Indian Nationalised Banks” opined that the banks have become an instrument to meet effectively the needs of the development of the economy to effect the total socioeconomic transformation. It has adversely affected the profitability of the bank operations. According to the researcher, the profitability of a bank is determined and affected mainly by two factors: spread and burden. The other factors determining bank’s profitability are credit policy, priority sector lending, massive geographical expansion, increasing establishment expenses, low non-fund income, deposit composition etc. She has chosen 11 factors affecting a bank’s profitability to identify the most significant variable affecting its profitability.
Dong (2010) reported that the firms‟ profitability and liquidity are affected by working capital management in his analysis. Pooled data are selected for carrying out the research for the era of 2006-2008 for assessing the companies listed in stock market of Vietnam. He focused on the variables that include profitability, conversion cycle and its related elements and the relationship that exists between them. From his research it was found that the relationships among these variables are strongly negative. This denote that decrease in the profitability occur due to increase in cash conversion cycle. It is also found that if the number of days of account receivable and inventories are diminished then the profitability will increase numbers of days of accounts receivable and inventories.
To evaluate the profitability trends of selected diamond Companies in India.
Source of Data: The study is based mainly on secondary data relating to the study was obtained from the annual reports of the companies. In addition, Magazines, Journals were also referred for finalising the methodology for the study.
Period of Study: The study covers a period of 10 years covering a period from 2004-2005 to 2013-2014. It is also decided by taking into consideration of the availability of data.
Sample of the Study: The researcher have selected only 9 companies irrespective of their size to see to what extent they are profatibility position. The selected companies Asian Star Co Ltd, Goenka Diamond, Rajesh Exports, Gitanjali Gems, Classic Diamonds, Winsome Diamond And Jewellery, Shrenuj And Company, Goldiam International, C. Mahendra Exports
The Secondary data was collected from annual reports of companies. Statistical tools are applied to analyse the financial performance with the help of ratios. Calculations were made to test the profatibility performance of selected companies of diamond sector.
Gross Profit Ratio
Net Profit Ratio:
Operating Ratio:
TABLE 6.1.1 GROSS PROFIT RATIO OF ALL THE SELECTED DIAMOND COMPANIES TAKING TOGETHAR
RS. IN CRORS YEAR NET PROFIT SALES NET PROFIT MARGIN RATIO (%) 2004-05
199.72
9517.97
2.1 Average 679.35 27802.11 2.28
2005-06
2006-07
2007-08
2008-09
2009-10
2010-11
2011-12
2012-13
2013-14
332.29
532.24
666.14
59.78
479.88
517.97
1516.69
1196.51
1292.31
11612.05
13657.07
17645.15
21194.01
29534.29
35430.81
45304.09
55893.82
38231.88
2.86
3.9
3.78
0.28
1.62
1.46
3.35
2.14
3.38
 NET PROFIT
Rs. 490.61
NET PROFIT
Rs. 490.61
SALES
Rs. 15,665.89
C. V. (%)
NET PROFIT
72.22%
SALES
56.35%
r
0.7907
r2
0.6253
The gross profit ratio expresses relation between gross profit and net sales. This ratio indicates efficiency of production/trading operations. The sales and gross profit ratio of all the selected diamond companies taking together have been presented in table 6.1. It can be analyzed from the table that the gross profit of diamond companies marked increasing and decreasing trend during the study period registered the growth rate of 547 % and also increasing trend in sales from Rs. 9517.97 crores in 2004-2005 to Rs. 38231.88 crores in 2013-2014 marked a growth rate of 301.68% which was much higher than the gross profit. The average gross profit ratio is 60.95%. The coefficient of correlation was 0.7907 and coefficient determination was 0.6253 which was shown quite positive relationship between them.
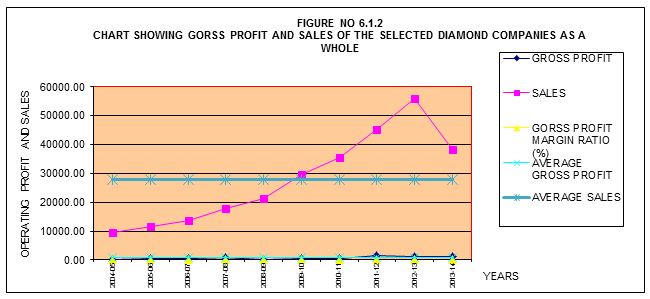
TABLE : 6.1.3 |
|||||||||||||||||||||||
GROSS PROFIT RATIO OF THE INDIVIDUAL SELECTED DIAMOND COMPANIES |
|||||||||||||||||||||||
(IN PERCENTAGE) |
|||||||||||||||||||||||
NAME OF COMPANY |
2004-05 |
2005-06 |
2006-07 |
2007-08 |
2008-09 |
2009-10 |
2010-11 |
2011-12 |
2012-13 |
2013-14 |
AV |
||||||||||||
Consolidated |
2.10 |
2.86 |
3.90 |
3.78 |
0.28 |
1.62 |
1.46 |
3.35 |
2.14 |
3.38 |
2.28 |
||||||||||||
Asian Star Co Ltd |
5.02 |
6.03 |
6.51 |
5.54 |
5.34 |
4.60 |
4.41 |
4.05 |
3.70 |
3.88 |
4.41 |
||||||||||||
Rajesh Exports |
-1.43 |
-1.64 |
0.71 |
0.56 |
-4.65 |
-1.79 |
-1.90 |
2.37 |
2.05 |
2.62 |
-0.17 |
||||||||||||
Goenka Diamond |
2.83 |
3.20 |
7.75 |
8.51 |
5.62 |
8.88 |
10.23 |
1.55 |
3.00 |
2.07 |
5.08 |
||||||||||||
Gitanjali Gems |
2.42 |
5.60 |
5.34 |
6.72 |
7.71 |
6.86 |
6.91 |
5.23 |
4.71 |
5.40 |
5.45 |
||||||||||||
Classic Diamonds |
7.20 |
11.56 |
11.83 |
9.38 |
6.46 |
13.69 |
8.48 |
6.64 |
-1872 |
-723 |
-252 |
||||||||||||
Winsome Diamond And Jewellery |
4.42 |
4.68 |
4.62 |
3.59 |
3.11 |
3.56 |
3.26 |
2.88 |
-1.61 |
-24.94 |
-0.09 |
||||||||||||
Shrenuj And Company |
7.39 |
8.93 |
9.77 |
10.20 |
9.51 |
9.88 |
7.41 |
7.40 |
6.51 |
5.95 |
7.56 |
||||||||||||
Goldiam International |
11.38 |
13.26 |
9.91 |
-0.24 |
-8.33 |
14.15 |
6.64 |
6.69 |
8.77 |
7.46 |
5.83 |
||||||||||||
C. Mahendra Exports |
3.76 |
6.09 |
9.90 |
7.95 |
6.46 |
9.28 |
6.58 |
5.26 |
5.66 |
4.00 |
6.12 |
||||||||||||
The gross profit ratio in individual selected diamond companies have been presented in table 6.1.3 and Figure 6.1.2.Both the table and chart clearly indicates that the shrenuj company has earned a handsome gross profit among all the selected diamond companies as its average gross profit ratio was 7.56%, moreover the overall trend of the ratio was towards increasing. The second rank in i.e. goes to Goldiam diamond 5.83%. The average gross profit ratio of the above diamond companies remained above than the consolidated average of 2.28% which indicates the capacity of these companies to earn gross profit per each rupee of sales.
TABLE 6.2.1 NET PROFIT MARGIN RATIO OF ALL THE SELECTED DIAMOND COMPANIES TAKING TOGETHAR
RS. IN CRORS |
||||||
YEAR |
NET PROFIT |
SALES |
NET PROFIT MARGIN RATIO (%) |
|||
2004-05 |
170.96 |
9517.97 |
1.8 |
|||
Average |
389.56 |
27802.11 |
1.73 |
|||
|
||||||
 NET PROFIT
Rs. 287.95
NET PROFIT
Rs. 287.95Net profit margin ratio is known as profit or return on sales ratio. It measures the relationship between net profit and net sales of a firm. Net profit, sales and net profit margin ratio of all the selected companies taking together in table 6.2.1. It can be analyzed from the table that the diamond industry has recorded fluctuating trend in net profit. It marked as low as Rs. -69.48 crores in 2013-2014 to as high as Rs. 866.05 crores in 2011-2012 whereas the net sales marked the increasing trend during the study period it raises from Rs.9517.17 crores in 2004-2005 to Rs.38231.88crores in 2013-2014 to registered a growth rate of 301.6886% The standard deviation of net profit and sales was Rs. 287.95 crores and Rs. 15665.89 crores respectively. Whereas the coefficient of variations of both the above variables was 73.92% and 56.35% respectively. It indicates the variability of net sales is much higher than the net profit. The coefficient of correlation and coefficient of determination between these two variable 0.1301 and 0.0169 respectively indicates the little positive relationship.
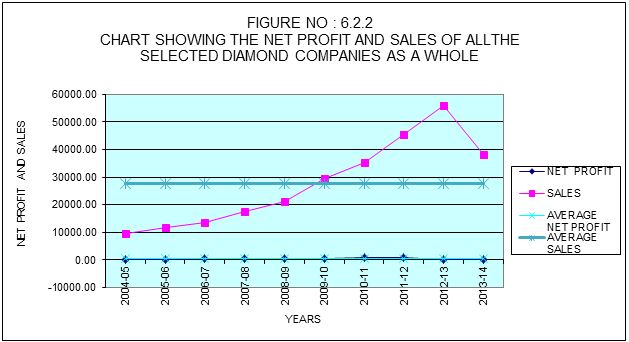
TABLE : 6.2.3 |
|||||||||||||||||||||||
NET PROFIT MARGIN RATIO OF THE INDIVIDUAL SELECTED DIAMOND COMPANIES |
|||||||||||||||||||||||
(IN PERCENTAGE) |
|||||||||||||||||||||||
NAME OF COMPANY |
2004-05 |
2005-06 |
2006-07 |
2007-08 |
2008-09 |
2009-10 |
2010-11 |
2011-12 |
2012-13 |
2013-14 |
AVE |
||||||||||||
Consolidated |
1.80 |
2.28 |
2.54 |
3.20 |
1.50 |
1.79 |
2.13 |
1.91 |
0.28 |
-0.18 |
1.55 |
||||||||||||
Asian Star Co Ltd |
2.08 |
2.29 |
2.37 |
3.09 |
1.51 |
2.10 |
1.74 |
1.74 |
1.77 |
1.78 |
1.84 |
||||||||||||
Rajesh Exports |
1.06 |
1.26 |
1.53 |
2.53 |
0.77 |
1.08 |
1.23 |
1.61 |
1.40 |
0.96 |
1.24 |
||||||||||||
Goenka Diamond |
1.09 |
1.18 |
3.66 |
6.21 |
6.03 |
7.09 |
8.11 |
4.00 |
3.34 |
0.80 |
4.04 |
||||||||||||
Gitanjali Gems |
0.65 |
2.95 |
3.69 |
5.20 |
4.71 |
4.23 |
4.38 |
3.33 |
2.55 |
-0.31 |
3.07 |
||||||||||||
Classic Diamonds |
2.18 |
2.52 |
3.45 |
4.77 |
0.58 |
2.48 |
1.20 |
-13.18 |
-2487 |
-1386 |
-387 |
||||||||||||
Winsome Diamond And Jewellery |
2.96 |
3.22 |
3.15 |
2.92 |
1.37 |
2.14 |
2.62 |
1.73 |
-5.98 |
-6006 |
-599.5 |
||||||||||||
Shrenuj And Company |
2.28 |
3.17 |
3.41 |
3.07/ |
1.46v |
1.50 |
1.96 |
1.72 |
1.36 |
1.39 |
1.90 |
||||||||||||
Goldiam International |
13.60 |
16.68 |
8.66 |
-0.08 |
-24.34 |
13.63 |
8.08 |
9.31 |
8.71 |
7.98 |
4.86 |
||||||||||||
C. Mahendra Exports |
2.44 |
2.69 |
4.96 |
2.95 |
1.49 |
1.35 |
3.10 |
2.01 |
1.48 |
0.29 |
2.03 |
||||||||||||
Net profit margin ratio of the individual selected companies has been presented in the table 6.2.3 and in Figure 6.2.2 . It can be analyzed from both table and chart that the net profit margin position of goldiam and gitanjali companies earned highest net profit ratio that being 4.86% and 4.04% which was higher than the consolidated average ratio.
TABLE 6.3.1 OPERATING RATIO OF ALL THE SELECTED DIAMOND COMPANIES TAKING TOGETHAR
RS. IN CRORS |
||||||
YEAR |
NET PROFIT |
SALES |
NET PROFIT MARGIN RATIO (%) |
|||
2004-05 |
9331.90 |
9517.97 |
98.05 |
|||
Average |
28624.76 |
27802.11 |
97.66 |
|||
|
||||||
Operating ratio measures operating efficiency. It measures what portion has been expended towards operating cost out of net sales. The operating expenses, sales and operating ratio of all the diamond companies under study have been shown in table 6.3.1. The operating expenses registered increasing trend. The operating expenses increased from Rs. 9331.90 crores in 2004-2005 to Rs.36978.19crores in 2013-2014 marked a growth rate of 296.26% in comparison to sales which registered a growth rate of 300.68%. The operating ratio remained above than average ratio of last two years of the study period. The standard deviation of the operating expenses and sales are Rs. 15294.08 crores and Rs. 15665.89 crores respectively. The coefficient of variation in case of operating expenses being 53.43% is marginally higher than that of in sales being 56.35%. The coefficient of correlation is 0.9998 and coefficient of determination is 0.9996 which indicates perfect positive relationship between them.
The profitability position in diamond industry was highly unsatisfactory in diamond industry as in majority of the diamond companies gross profit ratio and net profit ratio was highly unsatisfactory. It can be concluded that the profitability position was these companies was unsatisfactory as the creditors of these companies do not have sufficient cushion of profitability of companies . It can be concluded from analysis gross profit ratio that the profitability position of the diamond companies was very unsatisfactory during the entire period of study.
***************************************************
Goyani Mukesh R
Asst. Professor.
R.V.Patel College Of Commerce Amroli , Surat


Home | Archive | Advisory Committee | Contact us