Managing and reporting intellectual capital
Abstract :: Organisational (structural) capital
To understand why intellectual capital measurement has become very important in present corporate arena? This is mainly due to company’s success is now not merely dependent on investing in plants or machineries but also it is dependent on how the company spends and manage for continuous innovation, rely on new technologies and the skills and utilize knowledge of employees in optimum way.
As we know value can be generated by intangibles such as Intellectual Capital and not always reflected in financial statements and forward-looking companies have realized that these are an integral part of fully understanding the performance of their business. So, our study shows the importance of measurement of intellectual capital and various methods of it. The following points have been dealt with this paper in detail. Definitions of intellectual capital, Intellectual Capital measurement
1 .About intellectual capital ::
1.1 Introcuction
There is some confusion over how intellectual capital differs from intangibles, intangible assets or intellectual property. Why should you manage intellectual capital? Traditionally, the only intangible assets recognised in financial reporting statements were intellectual property ,such as patents and trademarks, and acquired items such as goodwill. Although it is still not possible to assign monetary values to most internally generated intangible assets, they nevertheless need to be considered if the process of value creation is to be properly understood. Failure to do so can have damaging consequences at all levels. For an individual firm, not understanding how value is generated can lead to inefficient resource allocation. It means the company does not fully understand its business model and may therefore be unable to assess the value of future into a perceived increased use of intangibles (energy-trading skills, provision of high-tech services). This sudden switch may have contributed to confusion among analysts and investors. Companies that measure and report intangibles may experience substantial gains. For example, Leif Edvinsson, former corporate director for intellectual capital at Swedish financial services company Skandia AFS, claims that a reduction in the cost of capital of 1 per cent was directly attributable to the company’s ability to measure andreport its intangibles.
Classification of intellectual capital, IFAC (1998)
Human capital
Relational (customer) capital
know-how
brands
education
Customers
Vocational qualifications
Customer Loyaalty
Work related knowledge
Backlog Orders
Psychometric Assessments
Distribution Channels
Work-related competencies
Business Collaborations
Entreprenurial Elan
Licencing agreement
Innovativeness, proactive and reactive abilities, changeability
1.2 Model
Intellectual property
Infrastructure assets
Patents
Management Philosophy
Copyrights
Corporate Culture
Design Rights
Management Processes
Trade Secrets
Information System
Trademarks
Networking Systems
Servicemarks
Financial Relations
Intellectual capital measurement Generic models:
1.2.1 Balanced scorecard:
In 1992, Robert Kaplan and David Norton pioneered their alanced scorecard (BSC). Since then, it has become a model or many of the reporting systems that include nonfinancial measures. Over the past decade, the balanced scorecard has volved from being a measurement framework to being a strategy implementation tool. It represents a set of cause-and-effect relationships among output measures and performance drivers in the four perspectives:
1.2.1.1 Financial measures: how do we look to shareholders, for example, cash flow and profitability
1.2.1.2 Customer measures: how do our customers see us, for example, price as compared with competitors and product ratings ;
1.2.1.3 Internal process measures: what must we excel at, for example, length of cycle times and level of waste;
1.2.1.4 learning and growth measures: can we improve and create value, for example, percentage of sales derived from new products. Today, Kaplan and Norton stress the importance of visualising causal relationships of measures and objectives in so-called strategy maps. These are essentially communication tools that visualise an organisation’s strategy and the processes and systems needed to implement it.
Although Kaplan and Norton insisted that companies should select their own measures, many have criticised the BSC model for being too limited. For the needs of all an rganisation’s stakeholders and the execution may be too driven from the top for it to be effective. It has also been said that some of the relationships between the four perspectives are more logical than causal. PricewaterhouseCoopers, in the recent book Building Public Trust, has disclosed the findings of an unpublished survey in which 69 per cent of executives reported “that they had attempted to demonstrate empirical cause-and-effect relationship between different categories of value drivers and both value creation and future financial results. Less than one-third of these felt they had truly completed the task; this suggests its difficulty”.
2. Performance prism
The performance prism (see figure 1) is a second-generation performance measurement and management approach developed by Cranfield School of Management in collaboration with consultancy Accenture. It recognises the importance of companies taking a holistic approach to stakeholder management in today’s culture of involvement. Its advantages are that it addresses all stakeholders –not only investors but customers and intermediaries, employees, suppliers, regulators and communities. It does this in two ways: by considering the requirements of those stakeholders and, uniquely, what the organization wants and needs from its stakeholders. In this way, the reciprocal relationship and the exchange process with each stakeholder is examined. The performance prism addresses the strategies, processes and, importantly, the capabilities that are needed to satisfy these two critical sets of wants and needs. The flexibility of the romance prism allows it to be applied to any organisation or organizational component. The focus on intangible performance drivers makes the framework useful for companies attempting to measure their intellectual capital. Also, it creates a visual map of how the different areas of performance interrelate. It explicitly acknowledges that all five facets of the performance prism should be covered in a so-called success map. This way, it avoids the often-criticised narrowness of the balanced scorecard. A more detailed description of the performance prism model can be found in CIMA’s technical briefing, “Latesttrends in corporate performance measurement” at www.cimaglobal.com/downloads/tech_brief_perf_man_160702.pdf. CIMA will soon publish an executive guide on performance reporting to boards which will include a case study showing how Shell implemented the performance prism.
Figure 2: hierarchy of knowledge assets
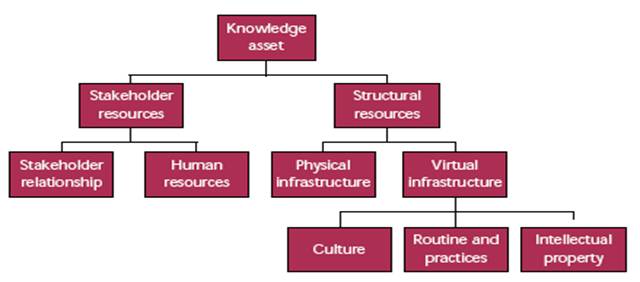
3. Knowledge assets
Map approach The knowledge assets approach takes a knowledge-based view of a firm. It was specifically designed to help companies identify and measure their knowledgebased assets and their contribution to value. Having identified the critical knowledge assets, they can easily be integrated into broader frameworks such as the performance prism. Knowledge assets are identified as the sum of two rganisational resources: stakeholder and structural. Thisdistinction reflects the two key components of any enterprise: its actors, who can be internal or external, and its constituent parts, or the elements at the basis of an organisation’s processes (see figure 2). Stakeholder resources are divided into stakeholder relationships and human resources the external and internal actors of a company. Structural resources are split into physical and virtual infrastructure, which refers to their tangible and intangible nature. Finally, the virtual infrastructure is further divided into culture, routines and practices, and intellectual property. Stakeholder relationships include all forms of relationships established by the company with its stakeholders. These relationships could be licensing agreements, financial relationships, or contracts and arrangements about distribution channels. It could also be customer loyalty, which represents a fundamental link between the company and one of its key stakeholders.
Human resources contains knowledge provided by employees in forms of competencies, commitment, motivation and loyalty as well as advice. Key components are also know-how, technical expertise, problemsolving capacity, creativity, education and attitude.
Physical infrastructure Comprises all infrastructure assets, such as structural layout and IT equipment such as computers, servers and physical networks. This category is often overlooked as a knowledge asset but plays a key role in how knowledge is shared.
Culture embraces corporate culture and management philosophies. Some important components are the organisation’s values, mission and vision. Culture is of fundamental importance for organisational effectiveness and efficiency, since it provides a framework, sometimes implied, through which to interpret events.
Routines and practices cover internal practices and virtual networks and routines. These routines could include tacit rules and procedures, such as manuals with codified procedures and rules, databases and tacit rules of behaviour or management style. They determine how processes are handled and how work flows through the organisation.
Intellectual property is the sum of patents, copyrights, trademarks, brands, registered designs, trade secrets and processes whose ownership is granted to the company by law. These are the tools and enablers that allow the company to perform its daily processes to produce results. This framework can be used to help identify knowledge assets, which can then be the basis for visualisation of how these assets are interrelated and transformed to satisfy stakeholder needs. Such a visualisation is called a value creation map (see figure 3) and it hows the pathways of how value is created in organisations. Knowledge assets are represented in bubbles linked with arrows. The size of individual bubbles represents stocks of particular knowledge assets in terms of strategic importance and arrows of different thickness show the transformations and relationships between knowledge assets and stakeholder needs (based on a concept by G Roos (1997)). A map can be used to visualise the static and dynamic nature of IC and how it adds value to different stakeholders. It is possible to provide a wide range of indicators for each of the categories listed: it is up to the management team to identify the most meaningful ones. Care needs to be taken when selecting the metrics. Many of those proposed in accounting literature tend to be general and fail to address the types of knowledge that play a critical role in value delivery for individual companies. Managers need to start by recognizing that knowledge assets are unique to each company and the metrics selected should therefore reflect this
4. Knowledge management
Intellectual capital and knowledge management (KM) should not be confused. It is essential for all companies to maintain and grow their IC stocks –rather than simply measure them – and knowledge management is one way of helping them to do this. But the two are quite distinct: KM is a process within a company, whereas IC covers its whole operations. As with many of the concepts in this area, there is no universal definition of knowledge management. The Gartner Group defines it as “a discipline that promotes an integrated approach to identifying, managing and sharing all of an enterprise’s information assets. These information assets may include databases, documents, polcies and procedures, as well as previously inarticulated expertise and experience resident in individual workers. KPMG came up with a more commonly used definition in 2001:
“Knowledge management is a collective phrase for a group of processes and practices used by organisations to increase their value by improving the effectiveness of the generation and application of intellectual capital.”
- Step one Calculate average pre-tax earnings for three years – $3.694 billion.
- Step two Go to the balance sheet and get the average year-end tangible assets for three years
- Step three $12.953 billion-Stage three Divide earnings by assets to get the return on assets (ROA) – 29 per cent.
- Step four For the same three years, find the industry’s average ROA. For pharmaceuticals the average is 10 percent (this method will not work if the ROA is below average).
- Step five Calculate the “excess return”. Multiply the industry average ROA by the company’s average tangible assets– 10 per cent x $12.953 billion. This is what the average drug company would earn from that amount of tangible assets. Subtract that from the company’s pre-tax earnings, which in the case of Merck would give an excess of $2.39 billion. This is how much more that company earns from its assets than the average drug manufacturer.
- Step six Calculate the three-year-average income tax rate and multiply this by the excess return. Subtract the result from the excess return to get an aftertax figure. This is the premium attributable to intangible assets. For Merck, with an average tax rate of 31 per cent, this is $1.65 billion.
- Step seven Calculate the net present value (NPV) of the premium. This is done by dividing the premium by an appropriate percentage, such as the company’s cost of capital. Using an arbitrarily chosen 15 per cent rate, this yields Merck $11 billion
- The research study is intended identity the intellectual capital with Indian companies
- The study help to understand human resources as intellectual capital
- The study gives better understanding about knowledge management.
- To give clear idea about how to calculate and manage intellectual capital
The paper is based purely on the secondary data which is collected through the different websites like www.intellectcap.com/ www.emeraldinsight.com Economic times , The management Accounting by ICWAI
4. Conclusion with data:
Intellectual capital is important to both society and rganisations. It can be a source of competitive advantage for businesses and stimulate innovation that leads to wealth generation. Technological revolutions, the rise to pre-eminence of the knowledge-based economy and the networked society have all led to the realisation that successful companies excel at fostering creativity and perpetually creating new knowledge. Companies depend on being able to measure, manage and develop this knowledge. Management efforts therefore have to focus on the knowledge resources and their use. Intangibles and how they contribute to value creation have to be appreciated so that the appropriate decisions can be made to protect and enhance them. There must also be acredible way of reporting those intangibles to the market to give the investment community comprehensive information to assist in valuing the company more accurately Huge investment flows in intangibles do not appear as positive asset values on financial statements, so the traditional accounting model does not represent them in a meaningful format. But financial statements should be seen as only a part of the jigsaw in how companies assess and communicate value. The finance function has a key role to play in managing knowlege assets and understanding and communicating sources of enterprise value. It may take a while to reach a consensus on what constitutes the best model for managing and reporting intangible value drivers. But experimentation is invaluable if we are to agree on best practice and arrive at a point of convergence between the disparate approaches
REFERENCES :
***************************************************
Mr. Mukesh R.Goyani & Mr. Jignesh P.Vaghela
R.V.Patel & V.L.Shah college of commerce
Amroli, Surat , Guajrat pin -394107
Mob 9724847568
Email : mukeshgoyani@yahoo.com


Home | Archive | Advisory Committee | Contact us