THERMOLUMINESCENCE STUDY OF CERAMIC MATERIAL
ABSTRACT
Many flooring materials most of them are in natural form are used to manufacture floor tiles for household flooring purpose. The peoples demand for variety of flooring material Leeds to develop various types of ceramic tiles. In India ceramic industry is fast growing one, more then 450 units of manufacturing ceramic tiles, vitrified tiles and sanitary ware, situated around Morbi, Rajkot, Gujarat, India having an annual turnover of around Rs.5000 Cores. Many natural minerals are used as the raw materials required for the manufacturing ceramic ware. The following minerals are used to manufacturing the ceramic tiles i.e. Quartz, Potash, Snow white, Ivory soda, China clay, Ukraine clay, etc. Most of the minerals are from Indian mines of Gujarat and Rajasthan states, some of are imported from Russian sub continent. The present paper reports the thermoluminescence characteristics of Ceramic Tile collected from the ceramic tiles manufacturing unit, Morbi. The as received minerals TL was recorded (NTL) and also 25Gy beta dose was given to each 5mg weighed sample and ATL was recorded. Annealed and quenched from 200, 400, 600, and 800oC followed by 25Gy beta dose given from Sr-90 beta source. Further the ceramic tile may be used as accidental thermoluminescence dosimeter (TLD) for high doses also studied.
Keywords: Ceramics; X-ray diffraction; thermoluminescence Dosimetry (TLD), TGA, etc.
Introduction:
The earliest disciplines to accept the TL technique in its fold in a variety of applications, such as dating of mineralization, igneous activities, sedimentation and evaluation of growth rate of beaches and sand dunes is Geology. The TL technique has been found useful in dating specimens of geologically recent origin where all other conventional methods fail. In a geological specimen, the TL would starts building up from the time of its crystallization and would normally continue throughout its existence due to the radioactivity present within the minerals and in the surrounding materials, till its saturates. The main basis in the Thermoluminescence Dosimetry (TLD) is that TL output is directly proportional to the radiation dose received by the phosphor and hence provides the means of estimating unknown irradiations /1/. Also, TL can provide a perfect passive measurement i.e. integrated irradiation levels over extended periods of the order of even years.
The present papers reports the thermoluminescence characteristics of the as received materials as well as annealed and quenched from 200, 400, 600, and 800oC followed by 25Gy beta dose given from Sr-90 beta source. The TL is recorded for the natural thermoluminescence (NTL) and followed 25Gy beta dose. The composite material is formed after heating the base materials plate at 1180oC for three hours which forms a glossy and glassy structure. The results are interesting. The TL peaks observed are around 149-369oC which are co-related to their natural counter parts. However the TL study of the final product i.e ceramic tile mixture is interesting in Thermoluminescence Dosimetry (TLD) point of view. Since the tiles are laid in homes, offices or schools in case of nuclear accident these tiles can act as thermoluminescence dosimetric materials /1-4/.
Experimental:The ceramic Tile is collected from the industry. The composite material of Ceramic Tile Powder is selected to recorded thermoluminescence. In the present paper the TL set-up manufactured by Nucleonix Systems, Hyderabad was used /1/. Irradiation was carried using Sr-90 beta source. Every time 5mg of weighed irradiated samples were taken.
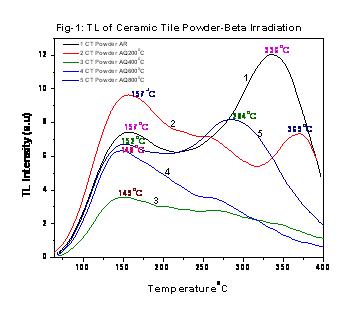
Results and DiscussionsFig-1 is the TL of Ceramic Tile Powder as received (AR), annealed and quenched (AQ) from 200, 400,600 and 800oC. The TL was recorded for 5mg weighed powder by giving 25 Gy beta dose from Sr-90 beta source. Curve-1 is the TL of 25 Gy beta irradiated as received Ceramic Tile Powder. It shows a well resolved peak around 157oC and followed by another well resolved peak at 336oC. Curve-2 is the TL of 25 Gy beta irradiated Ceramic Tile Powder annealed and quenched from 200oC. It displays a well resolved peak at 157oC followed by hump and a small peak at 369oC. Curve-3 is the TL of 25 Gy beta irradiated Ceramic Tile Powder annealed and quenched from 400oC. From curve-3 it is observed a broad peak around 149oC and a small hump with less intensity when compared to curve-2. Curve-4 is the TL of 25 Gy beta irradiated Ceramic Tile Powder annealed and quenched from 600oC. It shows a well resolved peak at 148oC followed by a small hump with little high intensity when compared to curve-3. Curve-5 is the TL of 25 Gy beta irradiated Ceramic Tile Powder annealed and quenched from 800oC. It displays a small peak at 152oC followed by a broad peak around 284oC with increased intensity when compared to curve-4. From the figure it is also observed that as the annealing temperature increases from 200 to 800oC entire TL pattern changes and finally well resolved small peak followed by a broad peak is obtained. This may be due to various phase changes occurred while annealing the mineral from 200-800oC temperatures.
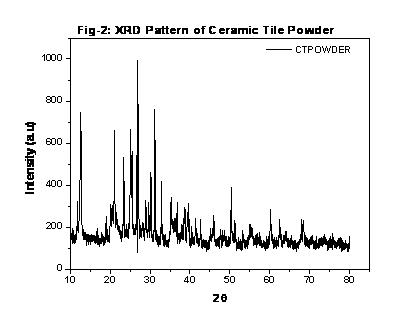
Fig-2 is the XRD pattern of Ceramic tile powder, it is clearly observed that the maximum peak obtained at 26.9o. The Crystallite size of Ceramic tile powder is calculated using Scherrer’s formula and is found around 171 nm.
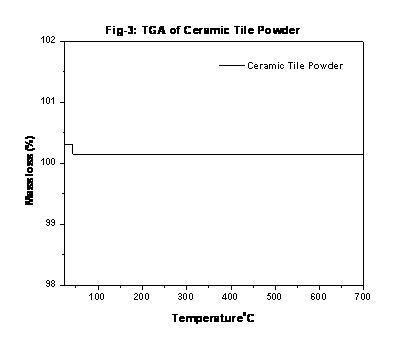
Fig-3 is the TGA of Ceramic tile powder. From figure it is found that there are many phase changes in the temperature range of 50oC - 700oC. Since the material is heated at 1200oC to get the Ceramic tile there is no phase change.
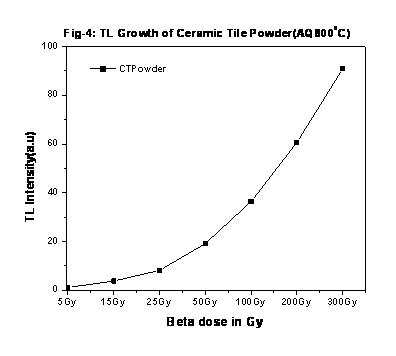
Fig-4 is the TL growth curve of Ceramic Tile Powder annealed and quenched from 800oC. The sample was given the following beta doses 5, 15, 25, 50, 100, 200 and 300Gy using Sr-90 beta source. The 5 mg weighed beta irradiated powdered sample was used for TL measurement. From the figure it is noted the growth increases up to 100Gy after 100Gy up to 300Gy it is a linear growth.
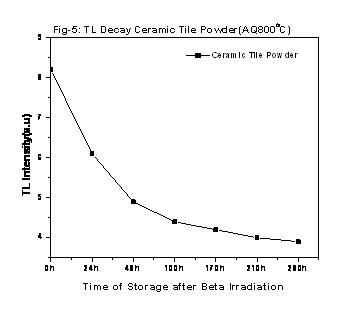
Fig-5 is the TL decay curve of Ceramic Tile Powder annealed and quenched from 800oC. TL was recorded after 24, 48, 100, 170, 210, 280hours of beta irradiation initially irradiated with beta dose of 25Gy using Sr-90 beta source. The 5 mg weighed beta irradiated powdered sample was used for TL measurement. From the figure it is noted the TL Intensity is gradually decreased with increasing the time of storage after beta irradiation. The TL decay percentage of Ceramic tile powder is about 51%. After 100- 280 hours of storage the decay is only 10%. This may be good TL dosimetric material for accidental nuclear fallout.
The formation of ceramic is confirmed by XRD as well as TGA. Thermoluminescence growth and TL decay characteristics of the ceramic tile mixture under TLD study, it is inferred the material ( Ceramic Tiles) are suitable for accidental TL dosimeter (TLD) for high radioactive dose range.
REFERENCES :
***************************************************
K.Ankama Rao
Department of Physics, VSR & NVR College, Tenali
Department of Physics, VSR & NVR College, Tenali
Department of Physics, VSR & NVR College, Tenali
K.V.R. Murthy
Applied Physics Department, M.S.University of Baroda, Baroda


Home | Archive | Advisory Committee | Contact us