Foreign Direct Investment in India
India is a country that has been able to restore investor confidence in its markets, even during the toughest of times. One of the most striking developments during the last two decades is the spectacular growth of foreign direct investment (FDI) in the global economic landscape. Increase in capital inflows, foreign direct investments (FDI) and overseas entities’ participation reflect the fact that Indian markets have fared well in recent times. Foreign direct investment (FDI) plays an extraordinary and growing role in global business. It can provide a firm with new markets and marketing channels, cheaper production facilities, access to new technology, products, skills and financing. For a host country or the foreign firm which receives the investment, it can provide a source of new technologies, capital, processes, products, organizational technologies and management skills, and as such can provide a strong impetus to economic development.
Foreign direct investment, in its classic definition, is defined as a company from one country making a physical investment into building a factory in another country. The direct investment in buildings, machinery and equipment is in contrast with making a portfolio investment, which is considered an indirect investment.
Economic reforms taken by Indian government in 1991 makes the country as one of the prominent performer of global economies by placing the country as the 4th largest and the 2nd fastest growing economy in the world. India also ranks as the 11th largest economy in terms of industrial output and has the 3rd largest pool of scientific and technical manpower. Continued economic liberalization since 1991 and its overall direction remained the same over the years irrespective of the ruling party moved the economy towards a market – based system from a closed economy characterized by extensive regulation, protectionism, public ownership which leads to pervasive corruption and slow growth from 1950s until 1990s.
In the past decade, FDI has come to play a major role in the internationalization of business. Reacting to changes in technology, growing liberalization of the national regulatory framework governing investment in enterprises, and changes in capital markets profound changes have occurred in the size, scope and methods of FDI. New information technology systems, decline in global communication costs have made management of foreign investments far easier than in the past. The sea change in trade and investment policies and the regulatory environment globally in the past decade, including trade policy and tariff liberalization, easing of restrictions on foreign investment and acquisition in many nations, and the deregulation and privitazation of many industries, has probably been the most significant catalyst for FDI’s expanded role.
In recent years, given rapid growth and change in global investment patterns, the definition has been broadened to include the acquisition of a lasting management interest in a company or enterprise outside the investing firm’s home country. As such, it may take many forms, such as a direct acquisition of a foreign firm, construction of a facility, or investment in a joint venture or strategic alliance with a local firm with attendant input of technology, licensing of intellectual property.
The most profound effect has been seen in developing countries, where yearly foreign direct investment flows have increased from an average of less than $10 billion in the 1970’s to a yearly average of less than $20 billion in the 1980’s, to explode in the 1990s from $26.7billion in 1990 to $179 billion in 1998 and $208 billion in 1999 and now comprise a large portion of global FDI.. Driven by mergers and acquisitions and internationalization of production in a range of industries, FDI into developed countries rose to $636 billion, from $481 billion in 1998 (Source: UNCTAD).
The unprecedented growth of global FDI in 1990 around the world make FDI an important and vital component of development strategy in both developed and developing nations and policies are designed in order to stimulate inward flows. Infact, FDI provides a win – win situation to the host and the home countries. Both countries are directly interested in inviting FDI, because they benefit a lot from such type of investment. The ‘home’ countries want to take the advantage of the vast markets opened by industrial growth. On the other hand the ‘host’ countries want to acquire technological and managerial skills and supplement domestic savings and foreign exchange. Moreover, the paucity of all types of resources viz. financial, capital, entrepreneurship, technological know- how, skills and practices, access to markets- abroad- in their economic development, developing nations accepted FDI as a sole visible panacea for all their scarcities. Further, the integration of global financial markets paves ways to this explosive growth of FDI around the globe.
India Inc’s increasing presence over the global canvas and Indian government’s consistent support to the FDI space have facilitated remarkable developments and investments from overseas partners. Some of them are discussed hereafter:
Key Statistics
The services (including financial and non-financial) sectors attracted highest FDI equity inflows during April-October 2011-12 at US$ 3.43 billion. India received maximum FDI from countries like Mauritius, Singapore, and the US at US$ 61.2 billion, US$ 15.2 billion and US$ 10 billion, respectively, during April 2000-October 2011.
Adani Enterprises’ acquisition of Abbot Point Coal Terminal in Australia (US$ 2 billion) and the GVK Group’s purchase of Australia-based Hancock Coal’s Queensland coal assets (US$ 1.3 billion) were among the biggest outbound deals recorded in 2011.
Important Developments
The government of India is continuously working towards increasing FDI flows into the country. FDI rose by an impressive 56 per cent to US$ 2.53 billion in November 2011. The cumulative flows of for April-November 2011 aggregated to US$ 22.83 billion, exceeding the total FDI of US$ 19.43 billion for 2010-11 fiscal.
Recently, the Government has approved 20 FDI proposals worth Rs 1,935.24 crore (US$ 384.5 million). The approved major investments, that were consulted with Foreign Investment Promotion Board (FIPB) as well, are enlisted below:
TV Vision proposed to induce Rs 200 crore (US$ 39.81 million) of foreign investment through an issue of equity shares via an initial public offer (IPO). The deal is to undertake the business of broadcasting a non-news and current affairs TV channel.
FDI INFLOWS IN INDIA (from 1948-2010)
TABLE 1.1
Amount of FDI |
Mid 1948 |
March 1964 |
March 1964 |
March 1980 |
March 1990 |
March 2000 |
March 2010 |
In Crores |
256 |
565.5 |
916 |
933.2 |
2705 |
18486 |
123378 |
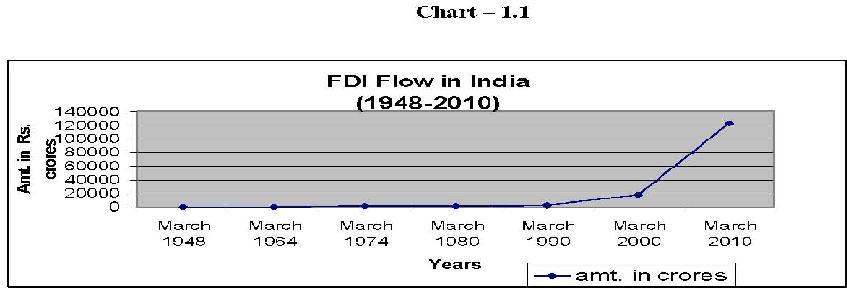
There is a considerable decrease in the tariff rates on various importable goods. Table –1.1 shows FDI inflows in India from 1948 – 2010.FDI inflows during 1991-92 to March 2010 in India increased manifold as compared to during mid 1948 to march 1990 (Chart-1.1). The measures introduced by the government to liberalize provisions relating to FDI in 1991 lure investors from every corner of the world. There were just few (U.K, USA, Japan, Germany, etc.) major countries investing in India during the period mid 1948 to march 1990 and this number has increased to fifteen in 1991. India emerged as a strong economic player on the global front after its first generation of economic reforms.
As a result of this, the list of investing countries to India reached to maximum number of 120 in 2008. Although, India is receiving FDI inflows from a number of sources but large percentage of FDI inflows is vested with few major countries. Mauritius, USA, UK, Japan, Singapore, Netherlands constitute 66 percent of the entire FDI inflows to India.
Finally, the study observes that FDI is a significant factor influencing the level of economic growth in India. It provides a sound base for economic growth and development by enhancing the financial position of the country. It also contributes to the GDP and foreign exchange reserves of the country.
***************************************************
Dr. Radha Tiwari, Ph.D (Economics)


Home | Archive | Advisory Committee | Contact us