Performance of the State Road Transport Undertakings in India
ABSTRACT ::
In India, the road transport is a dominant mode of transport in the movement of goods and passengers. The Road Transport Corporation Act, 1950 was enacted to enable State Governments to set up Transport Corporations with the object of providing efficient, adequate, economical and properly co-coordinated system of road transport services. This paper emphasized the performance of SRTUs. The paper also includes the factors which affect the efficiency of Road Transport Undertakings. As most of the State Road Transport Undertakings are not performing efficiently so recommendations are depicted in the paper which can be helpful to policy makers.
Introduction : -
Road transport is a transport on roads that is the most popular means of transportation on land, which doesn’t mean the rail transportation. In the wide sense, it includes every kind of transportation, which occurs on road. In India, the road transport is a dominant mode of transport in the movement of goods and passengers. It is sole mechanized means of surface transport to serve the hilly, rural and backward areas not connected by railways. As the existing services were found inadequate and few of them ill organized, Government considered nationalization of bus transport services as a means to ensure efficient, economical, adequate and properly co-ordinated services. With these objectives in view, the Road Transport Corporation Act was passed in 1950.
Road Transport Corporation Act, 1950 ::
“The Road Transport Corporation Act, 1948(XXXII of 1948), was enacted with a view to enable the Provincial Governments, who may so desire, to establish Road Transport Corporation. This Act has been found defective because the provisions of sections 3(2), 4 and 5 of the Act, insofar as they require certain provisions to be made by a Provincial law, are ultra virus of the Government of India Act1935, as adapted. Under the latter Act, the power to legislate in respect of trade and commerce is given to the provincial Legislature and the power to legislate for the incorporation of trading corporations is given to the Central legislature. The Road Transport Corporation Act, 1950 was enacted to enable State Governments to set up Transport Corporations with the object of providing efficient, adequate, economical and properly co-coordinated system of road transport services.
Since the inception of passenger transport services for rural, inter-city and urban areas by State Road Transport Undertakings (SRTUs) set up under the Road TransportCorporation (RTC) Act of 1950, bus-based public transport system continues to be dominated by the STUs in terms of coverage and patronage.
Performance of State Road Transport Undertakings ::
Bus-based public transport system continues to be dominated by the STUs today in terms of coverage and patronage. The SRTUs carry about 7 crores of passengers perday performing about 501 billion passenger kilometers annually. In the non-urban sectoralone, the SRTUs performed about 12.6 billion bus kilometers carrying a total of 477.5 billion passenger kilometers (pkm) of service.
However, despite the large role played by SRTUs in public transport operations, the share of STU owned buses as compared to the total number of registered vehicles has declined from 11.1% from its inception time in 1951 to 0.11% as on March 2009, which during its peak time in early 1980s was almost 45% of all the entire bus fleet in India. The extent of rural population served per bus varies from 4,535 in Andhra Pradesh and 11,435 in Rajasthan to 23,230 in Uttar Pradesh and 1,36, 639 in Bihar.
The declining share of SRTU in passenger transport can be partly attributed to the fact that there were a total of 23,000 over-aged vehicles (as per existing standards) as on March, 2009 as reported by 27 SRTUs. Add to that, the cancelled kilometers of STUs in 2008-09 were around 590.69 lakh kms due to inadequate number of buses.
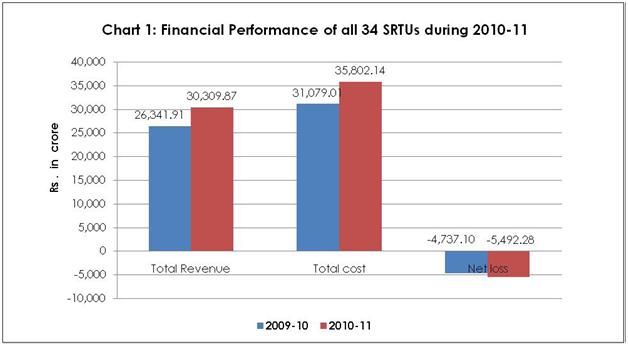
The net aggregate loss incurred by 34 SRTUs for which data on financial parameters has been received, increased by 15.9% from Rs. (-) 4737.10 crore in 2009-10 to Rs. (-) 5492.28 crore in 2010-11 (Table 1). The financial performance of all reporting SRTUs is given in the table below.
Financial Performance of 34 Reporting SRTUs
Sr. No. |
Financial Performance |
All SRTUs |
Percent Change |
|
2009-10 |
2010-11 |
|||
1 |
Number of Reporting SRTUs |
34 |
34 |
- |
2 |
Total Revenue (Rs. Crore) |
26,341.91 |
30,309.87 |
15.1 |
3 |
Total Cost (Rs. Crore) |
31,079.01 |
35,802.14 |
15.2 |
A |
Operating Cost (Rs. Crore) |
23,501.04 |
27,142.85 |
15.5 |
B |
Non-Operating Cost (Rs. Crore) |
7,577.97 |
8,659.30 |
14.3 |
4 |
Net Profit / Loss (Rs. crore) |
-4,737.10 |
-5,492.28 |
15.9 |
The summary of financial performance of the reporting SRTUs is given in Chart 1.
Cost structure ::
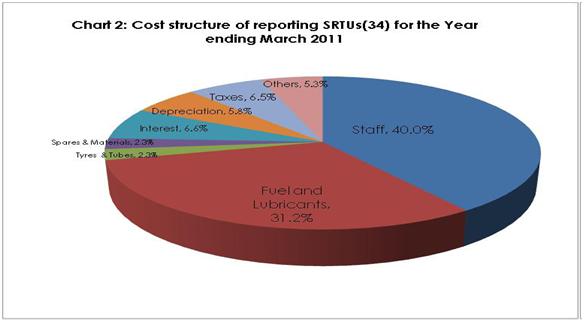
The cost structure of reporting SRTUs for the years ending March 2010 and March 2011 indicate that staff and fuel costs were the major elements of operating cost. These accounted for about 71% of the total costs; with staff costs and fuel cost constituting around 40% and 31% of the costs, respectively.
The performance of all the reporting SRTUs reflects that non-operating costs accounted for only 24.2% of the total costs during the year 2010-11. Taxes accounted for 6.5% of the total costs despite the fact that there were wide variations in the structure and rates of Motor Vehicle taxes among the States. The operating cost components for all SRTUs are given in Table 3 and of individual SRTUs are brought out in Annexure II. The graphical representation of the cost structure of SRTUs during 2010-11 is given in Chart 2.
Cost Structure and Its Components : 2010-11 |
|||
Sr.no |
Cost component |
Year Ending |
|
|
|
March-2010 |
March-2011 |
|
A) Operating Cost |
|
|
1 |
Staff |
40.5 |
40.0 |
2 |
Fuel & Lubricants |
30.6 |
31.2 |
3 |
Tyres & Tubes |
2.2 |
2.3 |
4 |
Spares & Materials |
2.3 |
2.3 |
|
B) Non-Operating Cost |
|
|
1 |
Interest |
6.6 |
6.6 |
2 |
Depreciation |
5.8 |
5.8 |
3 |
Taxes |
6.5 |
6.5 |
4 |
Others |
5.5 |
5.3 |
Profit & Loss ::
As passenger service providers/operators, financial viability and sustainability of SRTUs is important for undertaking fleet expansion, providing quality and volume of passenger service. An insight into the financial aspect of SRTUs can be gauged from revenue/km., cost/km., profit/loss per km., revenue/bus/day, cost/bus/day, profit/bus/day were also worked out for the various SRTUs.
During the year 2000-11, the performance of SRTUs reveals that 34 reporting SRTUs earned total revenue of Rs 30,309.87 crore and incurred a cost of Rs. 35,802.14 crore which translated into a net loss of Rs 5,492.28 crore during the year 2010-11. This contrasts with the net loss of Rs. 4,737.10 crore during the 2009-10. Amongst the 34 reporting SRTUs, only 5 SRTUs posted profit during the fiscal year 2010-11.
Factors affecting the Efficiency of SRTUs ::
Drop in occupancy ratio (i.e. average percentage of seats in a bus taken by passengers):The occupancy ratio of SRTUs has come down significantly from 71% in 1995-96 to 66% in 2008-09. This is because of the competition from other modes which have gained importance due to decreasing fleet size of SRTUs. Also the buses available were of poor quality, unreliable and in some ways do not provide the level of service which are offered by competing modes. However there is some improvement in the occupancy ratio of SRTUs which was again 71% during 2009 10.
Fleet Utilization - Although fleet utilization has improved from 88 percent in 1995-96 to 92.3 percent in 2009-10, There is considerable variation in fleet utilization across SRTUs as can be seen in Annexure 2 which points towards scope for improvement, for e.g. fleet utilization was as high as 99.5% in case of APSRTC and a low of 42.5% in case of Bihar SRTU.
Bus Staff Ratio - The staff bus ratio has dropped from 8.1 in 1995-96 to 5.98 in 2009-10 and is in the optimum range of 5.5 to 6. However the variation among SRTUs is quite pronounced as can be seen from Annexure 1. It varies from a high of 23.21 in Mizoram SRTU to 3.38 in Orissa which points towards considerable scope for improvement in man power utilization.
Fuel efficiency - Fuel efficiency is a function of age of bus fleet, maintenance, competence of drivers and terrain. Although over all fuel efficiency in terms of km per liter has improved from around 4.4 in 1995-96 to 4.91 in 2009-10 (5.13 for rural operation) there still seems to be a lot of scope for improvement. At present there are many SRTUs which have attained fuel efficiency of more than 5 km per liter during 2010-11.
Absence of fare revision mechanism - Fuel cost and man power cost accounted for 32 and 40 percent respectively of the total cost in 2010-11. Though the cost of manpower has come down during the last few years, the cost of fuel has been increasing which in the absence of a suitable fare revision mechanism is adding to the losses of the SRTUs.
Recommendations:
Most of the SRTUs are loss making and their performance is downgrading. So to improve the performance some suggestions which should be follow.
- The government should provide adequate financial incentives to SRTUs which helps to improve financial viability, improve services and infrastructures so as to compete with the private operators.
- In fact, government should establish special institutional set up for funding SRTUs.
- The government should take complete measures to ensure that private operators pay the same registration fee like SRTUs for establishing fare, healthy and competitive environment for transport operators.
- The government should impose the private operators for shared social obligations of connecting the rural areas with SRTUs. Otherwise, SRTUs should adequately reimburse for fulfillment of such obligations.
- The government should regularize the reimbursement of expenses incurred by the SRTUsin subsidizing the travel of students & other special categories, for operating non-economic routes etc. SRTUs should fully compensate by the government for such social service obligations.
- The government should allowed SRTUs to decide its service price based on market conditions rather than political and social conditions which helps SRTUs to achieve financial viability.
- Management of SRTUs should achieve high operational efficiency by effectively utilizing available recourses, timely replacement of vehicles, and reduced breakdown by proper maintenance, appropriate route scheduling, punctuality and safety in operations.
- Management should develop strong monitoring mechanism for surprise checking.
- The management should take strong actions for reducing operating expenses especially staff productivity, fleet utilization and occupancy ratio.
- The management should adopt principles of scientific management. It should also render the services of experienced professionals for managing its operations or policy decisions if felt necessary.
- The management should adopt scientific approach in major areas of Human Resource Management namely recruitment, training, goal setting, performance appraisal and incentives plan etc.
References::
***************************************************
Prof. Dipal K. Kothia


Home | Archive | Advisory Committee | Contact us