EXPORT PERFORMANCE OF SEZs IN INDIA
Abstract : Introduction: The globalization affected the world trading community and forced the world countries to introduce certain policies to enhance the current international trade. So many policies emerged as a tool for the growth of international trade. Among such introduced policies was the Special Economic Zone policy. The emergence of SEZs as ‘an engine for economic growth’ or ‘a tool for economic growth’ is a widely discussed issue. The basic Objective of SEZs is to generate additional economic activities, promote investment from domestic and foreign sources and improve the competitiveness of exports of our goods and services. Purpose: The present paper aims at evaluating the export performance of SEZs in India. To testify the performance of the Special Economic Zones, in this research paper attempts has been made to study the total exports of SEZs in India during2001-02 to 2013-2014, share of SEZs in the total exports of India, employment generation by SEZs in India. Research Design: The research design used for the study is descriptive in nature as the study facts already exists. Methodology: In this research paper secondary data will be used and secondary data will be collected through the official website of Department of Commerce, websites of various SEZs, and various research papers, journal articles, magazines and newspapers. This research paper evaluates the performance of the zones by using the secondary data. The percentage analysis and the CAGR (compound annual growth rate) methods are used to analyze the data. Findings: The study finds that there is significant increase in the exports from SEZs in India, the share of SEZs in total India’s export is also increasing, but the concentration of SEZs is in few states and few sectors in the economy. It is evident from the analysis that SEZs are providing direct employment. SEZs are also playing an important role in attracting domestic as well as foreign direct investment. This paper states that although there is significant increase in SEZs exports, yet this increase is not uniform and there is lack of proper monitoring and reviewing the activities and performances of SEZs, so the policy makers and government should make sincere efforts to solve their problems. Keywords: Special Economic Zones (SEZs), Exports, Investment. SEZ is the acronym of Special Economic Zone. Initially it was known as Export Processing Zone (EPZ). Asia’s first EPZ was established in India in 1965 in Kandla, as India was the first country to feel the effectiveness of EPZs in promoting exports. Special Economic Zone is considered as special area meant only to promote exports and is treated as duty free regions considered to be a foreign territory for the purpose of trade operations and duties and tariffs. All the transfer of goods from SEZ to Domestic Tariff Area (DTA) is considered as imports and transfer from DTA to SEZs is considered as exports. In any SEZ, goods may be imported or obtained from DTA, for the purpose of manufacturing of goods and services, without paying the duty and for the purpose of production, assembling, and trading, etc. According to Dunning 1998," SEZs are industrial clusters of companies that are concentrated in a geographic region. These companies share economic infrastructure, a pool of skilled human capital, and governmental and other institutions that provide education, specialized training, information and technical support. Also, these companies may co-operate to create joint companies, distribution agreement, technology transfer agreements and common manufacturing agreements. External economies of scale and other advantages of the cluster help the operating firms in reducing costs, acquiring competitive advantages and attracting foreign direct investment." SEZ is recently very popular instrument in developing countries for pursuing not only export led growth strategies but also a useful tool for promoting industrialization. Various research papers by Agrawal & Verma, (2013) and Gope & Ghosh, (2009) evaluate the SEZs role in economic development. Ashok Kundra (2000) and Rajiv Kumar (1998)
evaluated the export performance of traditional EPZs and studies by Aggarwal (2004, 2005, 2006, 2007), Khurud, (2013), Lonarkar, (2014), Elangovan & Palanisamy, (0ct. 2013) and Tantri (2007) evaluated the export performance
of these zones after their conversion in SEZs. The research work undertaken by Aggarwal and Tantri evaluated export performance of these zones on aggregate level on the other hand research work done by Nidheesh. K.B, (2013) And Lonarkar, (2014) concentrated on the performance of specific zones and shown the relationship between exports and employment and investment. But not enough work has been done so far to show the relationship between change in exports and change in employment and investment. So this paper focuses on the Export contribution by SEZs in India and the correlation between exports, investment and employment. This paper primarily aims at evaluating the Export Performance of SEZs in India and secondarily it aims to check the correlation between export performance and employment generation and investment creation. So this study aims to focus on: The existence of SEZs can be considered dated back, in 1896; the first industrial Park was set up in Manchester, and was called as Free Trade Zone, to promote the free trade (Chandrachud & Gajalakshmi, 2013). In 1929 a special zone was established in Spain that was same as current time’s SEZ and was established to promote exports. To promote the third world economies International Monitory Fund and the World Bank adopted that idea in 1960s, and various countries are adopting the concept of SEZs to promote their exports. Malaysia and other ASEAN countries were the first to successfully use the concept of Export Processing Zones (EPZs) to increase exports, to reduce the foreign exchange constraints. China is the most successful practitioner of this instrument; it used the “FDI-Expert Model” of economic development and growth. There are five SEZs in China-Shenzhen, Xiamen, Shantou and Zhuhai were founded 20 years back and the fifth one, Hainan, was set up in 1988. In 1960s there were only 10 zones around the world, which increased to 176 zones in 47 countries in the 1980s. In 2006, this number increased to 3000. Asia’s first Export Processing Zone (EPZ) was set up in Kandla in 1965 followed by the Santacruz export-processing zone in Mumbai in 1973. Three committees were appointed by the government of India (The Kaul Committee – 1978, the Review Committee- 1979, Tondon Committee 1981) reviewed the working of these zones. To boost the exports, the government decided to establish four more zones in 1984. These were at Noida (Uttar Pradesh), Falta (West Bengal), Cochin (Kerala) and Chennai (Tamil Nadu). Thereafter, Visakhapatnam EPZ in Andhra Pradesh was established in 1989, it became operational in 1994. All these zones were set up in industrially backward regions except of Chennai. According to the Department of Commerce, Government of India (GoI), these zones were unable to perform better due to multiplicity of controls and clearances, the absence of world-class infrastructure and an unstable fiscal regime. So Govt. announced the SEZ policy in April 2000 to encourage exports, to provide an internationally competitive and hassle-free business environment and to overcome the shortcomings of EPZs. The SEZ policy was intended to export promotion, to make SEZ an engine for economic growth, to brought attractive fiscal packages and seeks to radically change the environment for exports and FDI (Maharashtra Economic Development Council (MEDC), 2008). Several fiscal incentives have been offered to units for setting up operations in SEZs to increase levels of productivity, with a resultant growth in investments and exports. The SEZ policy suffers from lack of central legislation, rigid labor laws and multi clearance of approval etc.
This was followed by the SEZ Act 2005, supported by SEZ Rules, which came into effect on 10 February 2006, meant for simplification of procedures and for single window clearance on matters relating to Central as well as State Governments. The SEZ Rules provide for different minimum land requirements for different classes of SEZs. According to the Ministry of External Affairs, since 2006, in addition to the seven SEZs that preceded the SEZ Act 2005, a large number of SEZs have been established and many more are in the pipeline. As of 1st September 2014, 564 formal approvals have been granted for setting up SEZs, of which 388 have been notified and 192 are exporting.
SEZs can be defined separately but the objective of their establishment remains same.
The main objectives of the SEZs are: There are various studies that support the objectives of SEZs. Khurud, (2013) Analyzed the data of the exports of all the SEZs during 2000-01 to 2010-11. The study is based on the secondary data. According to this article the exports from SEZs are increasing more rapidly than that of India’s exports. The growth in SEZs export was 121 percent as compared to the 0.57 percent growth in India’s export and the share of SEZs in the total exports is also increasing. This article states that Gujarat state is performing well and around 60 percent of the SEZs export in 2010-11 is in biotech and Chemical & Pharmaceuticals only. Despite this, SEZs have not proved to be cost-effective due to lack of sufficient infrastructure. The government, therefore, should create a more conducive atmosphere and provide sufficient administrative support to the SEZs. This will make the country's export more competitive and globally noticeable. Elangovan & Palanisamy, (0ct. 2013) analyzed the export performance of the Chennai’s SEZ and its contribution in the Balance of trade, sector wise export contribution and Sector wise growth of the Special Economic Zone, and found that Chennai SEZ plays an important role in the growth of Tamil Nadu state and the exports of the south region of India. Lonarkar, (2014) in his paper explained that there is significant change in the performance of SEZs over their predecessors EPZs. SEZs exports have increased several times and their share in total India’s export has also increased, this is applicable to almost all central SEZs except Falta SEZ. Singala, Atmavilas, & Singh, (2011) observed that the contribution of SEZs to the Indian economy is not according to the performance of its Chinese counterparts in terms of the overall exports. Moreover due to the land acquisition related issues the GoI should concentrate on implementing the SEZ policy and to reclaim the maximum results. Kumar & Singh, (2011) in their paper explained that SEZs are promoting exports and employment. In 2009-10 there was a huge rate of growth in exports i.e.52.5% and the employment increased from 134704 in 2006 to 489831 in 2009. Lakshmanan, (2009) in their report explained that in India there are loads of SEZs as compare to US, China and Indonesia, but only 5% of the multiproduct zones contribute toward growth of exports, investment and employment. Aggarwal A. , (2010) in her paper “Economic impacts of SEZs: Theoretical approaches and analysis of newly notified SEZs in India” she assessed the economic impacts of SEZs and revealed that SEZs not only stimulates direct investment and employment, but also appears to be more valuable in bringing about economic transformation. This study reveals that SEZs benefit the economy by shifting the resources from low productivity agriculture to more productive activities; promoting new knowledge intensive industries; augmenting existing industrial clusters/industrial states; diversifying the local industrial base; localizing global value chain; converting vicious circles into virtuous circles; and encouraging shift of economic activity from unorganized to organized sector. IBEF- India Brand Equity Foundation in their report “SEZs’ role in Indian manufacturing growth” stated that SEZs can be particularly helpful for small and medium sized firms that cannot afford to set up captive infrastructure facilities. According to this report manufacturing significantly dominates India’s SEZ exports, most of the operational SEZs are engaged into manufacturing activities and the SEZs’ export is estimated to increase. Wei, (1999) developed a dynamic framework to check the role of EPZs to promote the economic openness. New technology will lead to economic development of LDCs, globalization helps to generate external economies that make easy the process of technology transfer and learning. The study suggests, among other things, that the concept of export-processing zones may serve as an effective policy means, when implemented properly, in achieving greater economic openness and growth. The development process of countries having EPZs is quite different than the growth of the countries not having EPZs. Madani, (1999) Stated SEZs as an instrument for encouraging economic development, export-processing zones have only limited usefulness. A better policy choice is general liberalization of a country's economy. This paper - a product of Trade, Development Research Group - is part of a larger effort in the group to understand the impact of trade policy and trade policy tools on development. Nidheesh. K.B, (2013) In his article “Investment Performance of Cochin SEZ” he stated that there is a significance relationship between the investments made and employment opportunities created, tax incentives provided and the exports promoted in Cochin SEZ and also mentioned that after the enactment of SEZ Act 2005 the amount of investments in the Cochin SEZ is far better than the period prior to the SEZ act. Tantri, (2011) in her article “ The Dynamics Of SEZs Over EPZs: A Case Study Of Santacruz SEZ” she explained that SSEZs had recorded a significant growth in terms of increase in exports, in terms of number of exporting units and per unit’s exports. This improved performance of SSEZ is evidenced by its relatively better contribution to the total SEZ exports of the country on the one hand, and it’s increasing share in the country’s total Gems and Jewellery exports, on the others. Mane & Salave, (2014) in their paper “Aspects and Pitfalls of SEZ on Rural Economy of Maharashtra” they showed that the policy has yielded only modest results in terms of exports, employment and investments. The social costs of human displacement and the economic costs of land acquisition can be avoided by not acquiring the land under use for livelihoods, and they should not use the Land Acquisition Act for this purpose. Aggarwal A. , (2007) in her paper, she studied the direct impact of SEZs on human development and poverty in India and found that SEZs play major role in providing employment and help to reduce poverty but do not promote human capital development. She suggested that if SEZ wants to grow it is important that government should play active role in strengthening the relations between the various actors (government, university, and industry) necessary to encourage a situation where learning and innovations can be promoted, especially where there is lack of R&D individual capabilities. Effective measures need to be taken to create R&D infrastructure, and to build linkages between institutions and the SEZ units and to promote the funds for R&D. Zhiqiqng, (2002) examined that Investigation of the effect of Foreign Direct Investment to generate external benefits like technology transfer is measured using data on 29 manufacturing industries over the period from 1993 to 1998 in the Shenzhen Special Economic Zone of China, he find that foreign direct investment has large and significant spillover effects in that it raises both the level and growth rate of productivity of manufacturing industries and domestic sectors are the main beneficiaries. He also found that some domestic sectors benefit more than others from the external effects of foreign direct investment. The results are robust to a number of alternative model specifications. Agrawal & Verma, (2013) in their paper they revealed that trade policies play a very important role in decision making of an entrepreneur about the choice of location for setting up a business unit. Privileges and attention to large scale industries prevent to flourish medium and small scale industries. Thus, in developing countries like India, attitude of government in economic policy should be liberal enough to promote micro and local entrepreneurs. In this context skilled workforce and physical infrastructure is boosting element to attract potential investors and proactive SEZ policy towards these definitely supported export from SEZs. The study aims at bringing out the export contribution made by the SEZ. The total exports were main concentration of the study. Further the exports made were classified into year wise exports, SEZs wise exports, state wise exports, sector wise exports and share in India's total exports and how pattern of exports affect the current status of investments and employment in SEZs. In this paper total exports figure of all the SEZs operating in India viz.- seven Central Govt. SEZs, State/Pvt. SEZs notified before SEZ Act 2005 and the Notified SEZs under the SEZ Act 2005 from the time period 2000-01 till the year 2013-14 is collected. It is compared with the total India’s export data. Moreover the data regarding the total employment provided by all the SEZs in India and the data regarding the amount of total investment parked in these SEZs are also collected for the same period 2000-01 till period 2013-14. State-wise Exports of various SEZs data is collected from the year 2008-09 to the year 2013-14 is collected The present study is of analytical and exploratory in nature. Accordingly, the use is made of secondary data collected from different sources. The relevant secondary data are drawn primarily from various publications such as journals of management, Annual Reports of various Special Economic Zones like Kandla SEZ, Madras SEZ, Reports on Trend and Progress of Special Economic Zone in India, Report on Trend and Progress of total export of India after commencement of SEZ Policy, Annual Report of Ministry of Commerce, Annual Report of Export Promotion Councils, data from the reports of Director General of Foreign Trade, magazine such as Business India, India Today, Business World, Business and Economic and various websites were also referred to. The collected data is analyzed with the help of various statistical tools like Percentage analysis and CAGR (Khurud, 2013), (Elangovan & Palanisamy, 0ct. 2013) and (Tantri, 2011) and is presented in the form of Tables and Charts.
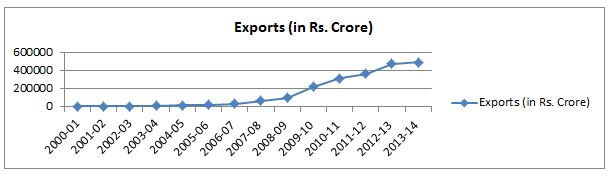
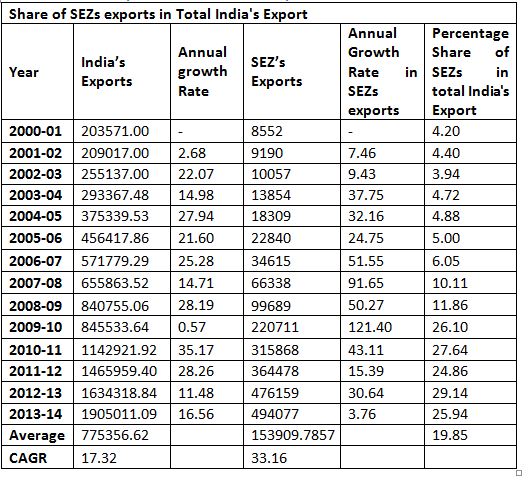
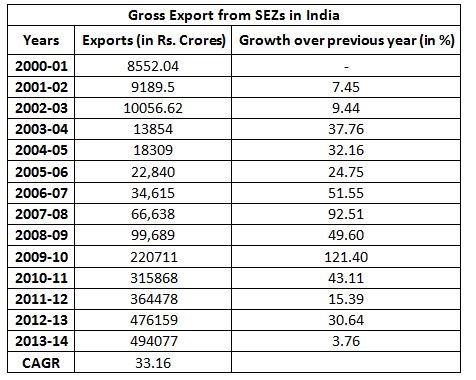
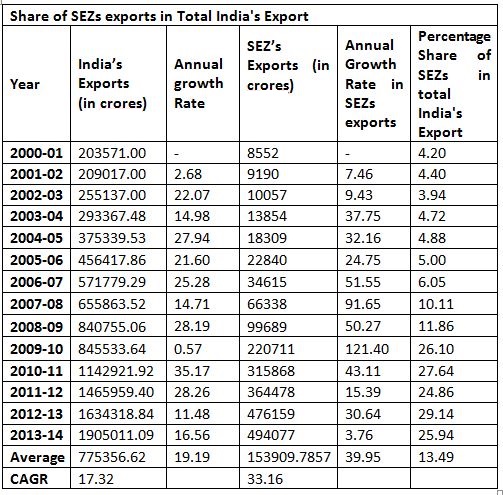
The study is limited as per the data collected from the official records of various departments. The conclusions drawn in the present study are subject to the veracity of data available. Undoubtedly, the published reports show the position of a concern on a particular date, which may not prove true for the whole of the year. But the researcher as an external analyst, with time constraint, has to depend upon the reports because it is not possible to compile the data originated at different times during the years. The researcher has undertaken the study from 2000-01 to 2013-14, hence the study is limited up to few years only, that is another limitation of the study. The introduction of SEZ Act in India proved to be a useful tool to attract foreign investments, creation of employment opportunities and promotion of exports(Gope & Ghosh, 2009).The three important objectives of the SEZ Act, 2005, are generation of employment opportunities, encourage investment (both private and foreign) and increase India’s share in global exports. The success of SEZs in meeting these objectives is analyzed in this section in order to assess their efficacy in India. Since the number of operating SEZs in India is very high, as compare to China, it is not possible to individually evaluate the performance of each SEZ. Therefore, the study undertakes an overall assessment of SEZs in India. The total exports of the SEZs in India are showing the increasing trend during the study period from 2000-01 to 2013-14. In the year 2000-01 total exports were amounting to Rs.8552.04 crores and was increased to Rs.13854 crores in the year 2003-04 recording a growth of 37.76%. In the year 2007-08 exports were of Rs.66638 crores with a growth of 92.51% from the previous year 2006-07 in which total exports recoded were Rs.34615 crores. In the year 2009-10 exports increased very sharply with the percentage growth recoded was. 121.40% and the exports were of Rs. 220711crores that was mainly due to the introduction of various new notified SEZs after that rate of growth in the exports started declining. In the year 2011-12 total exports were of amount Rs.364478 crores with a growth of 15.39 %only but in the year 2013-14 growth in the exports was quite less, it was only 3.76% and the amount of exports reached to Rs.494077 crores from Rs.476159 crores in 2012-13. Figure -1 shows that there is an increasing trend in the exports of SEZs in India. The total compound annual growth recoded over the span of this study period is 33.16 percent. SEZs are playing an important role in promoting the exports of India. Initially the share of SEZs in total India’s exports was quite less, in year 2000-01 total India’s export was Rs. 203571crores and the exports from SEZs in the same year was Rs. 8552 crores contributing 4.20 percent of the share in total India’s exports. But with the passage of time this share goes on increasing. In the year 2007-08 in the exports of Rs. 655863.52 crores of India, Rs.66338 crores were contributed by SEZs registering the percentage share of 10.11 percent. Later on this share was increased from 11.86 percent in 2008-09 to26.10 percent in 2009-10 with the export amount increased from Rs. 99689 crores to Rs. 220711crores recording a growth of 121.40 percent in the exports of SEZs. The higher percentage share recorded is 29.14 percent in the financial year 2013-14. The average exports of India during the study period is Rs. 775356.62crores and the average exports of SEZs during the same period is Rs. 153909.78 crores showing the average share of 19.85 percent in total India’s exports. The compound annual growth rate in exports in India’s exports is 17.32 percent and in case of SEZs CAGR recorded is 33.16 percent that is more than the growth on case of India’s exports. This show SEZs play an important role in SEZs exports.
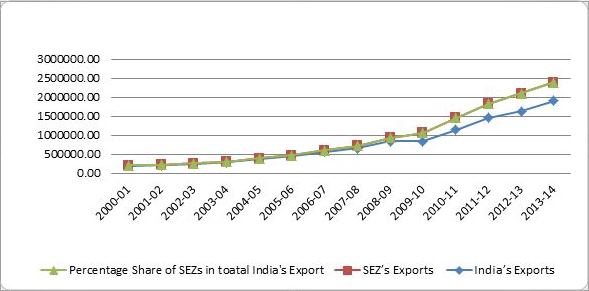
Table 2- Share of SEZs’ Exports in Total India’s Exports Note: - CAGR- Compound Annual Growth Rate The trend of the exports is shown in the figure -2.
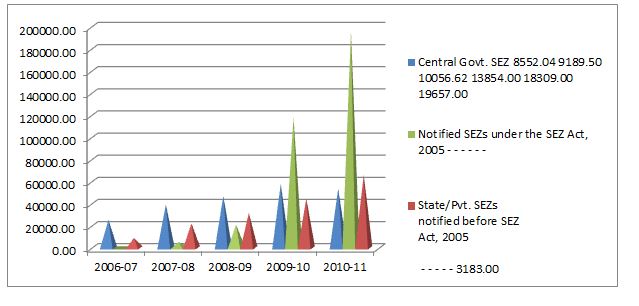
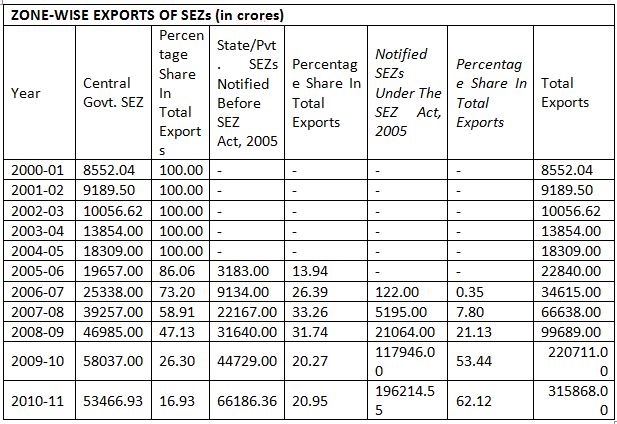
Figure 2-Trend in the share of SEZ's Exports in India's exports In India there are three types of zones established in India as shown in the Table-1.These three categories of SEZs in India are Central Government SEZs, State Govt. /Private SEZs established prior to SEZs act and SEZs notified under SEZs Act 2005. Prior to the year 2005-06 there were only Central Govt. SEZs, which were earlier known as Export Processing Zones (EPZ). They contributed 100 percent of the SEZs exports .In the year 2005-06 the contribution of State/Private SEZs Notified before SEZ act was 13.94 percent with exports amounting to Rs.3183 crores. In the year 2006 many more SEZs were notified under the SEZ act 2005. The recent data shows that the exports of new SEZs i.e. SEZs notified under the SEZs Act 2005 are growing rapidly over the years. The total amount of SEZs exports was Rs. 34615 crores in 2006-07 in which the Central Govt. SEZs contributed Rs. 25338 crores (73.2 Per cent) and State Govt. /Private SEZs Rs. 9134 crores (26.39 Per cent) and the notified SEZs contributed Rs.122 crores (0.35 percent). Figure-2 shows the contribution and sharp increase in Exports of notified SEZs and the decline of the Central Govt. SEZs.
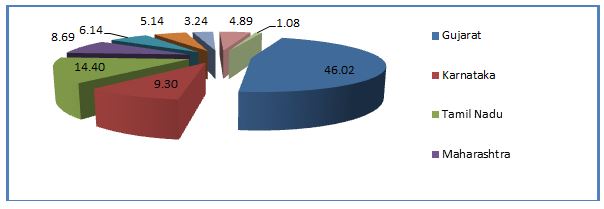
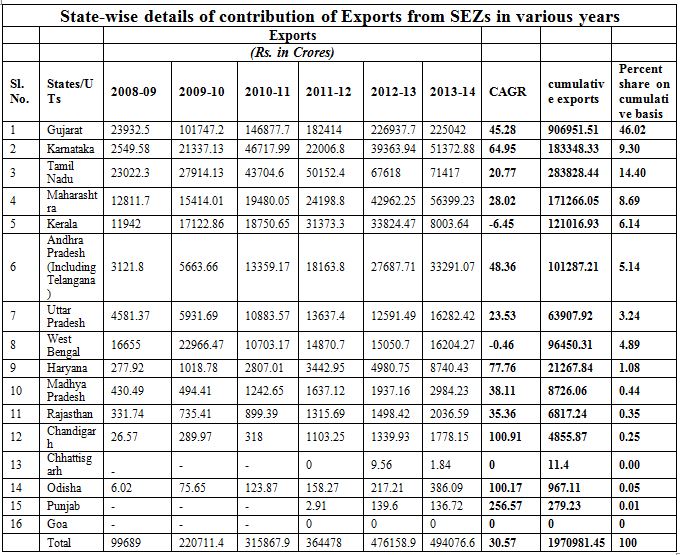
Figure 3- Zone-wise Exports/ SEZs-Wise Exports The percentage share of the Central Govt. SEZs, State/ Private SEZs notified before SEZ Act 2005 and the notified SEZs under the SEZ Act 2005 was 16.93 percent, 20.95 percent and 62.12 percent respectively in 2010-11. State wise exports performance of the SEZs shown in figure-4 shows that during the year 2008-09 to year 2013-14 Gujarat state solely contributed to 46.02 percent share in total SEZs exports, this was followed by Tamil Nadu with 14.40 percent share. After that Karnataka contributed to 09.30 percent Maharashtra with 8.69 percent and Kerala and Andhra Pradesh contributed to 6.14 percent and 5.14 percent respectively.
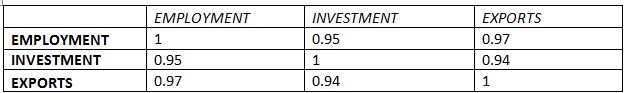
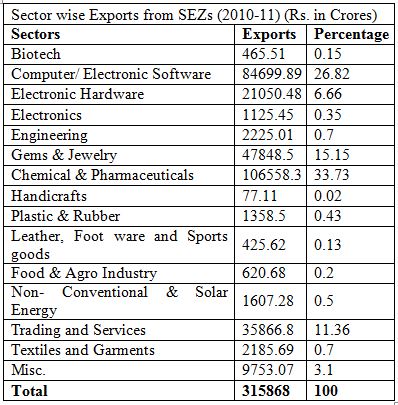
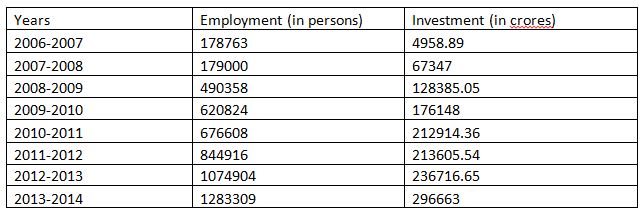
Figure 4- State-wise contribution of SEZ's Exports The share of West-Bengal is 4.89 percent and of U.P is 3.24 percent. The Shares of other states in total SEZs exports are very low ranging between 0.05percent to 1.08 percent during the period under study (See AnnexureTable-4). In terms of CAGR Karnataka recoded the higher growth rate i.e.65 percent followed by Andhra Pradesh with 48.36 percent growth, Gujarat with 45.28 percent growth. The growth recorded by The major contribution in the Export of SEZs in 2010-11 was played by the Chemical and Pharmaceuticals sector with 33.73 per cent share. This was followed by Computer and Electronic Software sector with 26.82 per cent share, Gems and Jewelry with 15.15 per cent share; Trading and Service sector with 11.36 per cent share and Electronic Hardware with 6.66 per cent share. Thus, mainly 93.72 percent of the SEZs exports came from five sectors only. Among all the Seven Central Govt. SEZs major contribution was by the Gems & Jewellery sector, it accounted for 74 percent of the Santacruz SEZ, 88 percent of the Cochin SEZ, for Noida SEZ, Madras SEZ, and Vizag SEZ it is 30 percent, 28 percent and 23 percent respectively (Lonarkar, 2014).But for Falta SEZ it was very less with 8 percent share. Investment promotion is one of the major objectives of the SEZs. Exports and employment level mainly depend upon the level of Investment. Table (Annexure-6) show that there is sharp increase in the total investments in the year 2008-09, it has increased from Rs.67347 crores in 2007-08 to Rs.128385 crores in 2008-09 showing almost 91percent increase. After that there is increasing trend in the total investment. It has increased from Rs. 176148 crores in 2009-10 to Rs.296663 crores in 2013-14. Many studies show that SEZs play an important role in boosting the investment level; moreover these investments are used further to get the foreign technology and to learn management skills so that exports can be increased. In a study it is clear that EPZs played the important role in the development of Mauritius (Romer, 1993), and in case of China it is the major source to boost In the case of India, SEZ Act, 2005 resulted in increased investment.(Huq, 2008). SEZs help in providing the direct as well as indirect employment. Some SEZs as Gems & Jewellery, Food items and Footwear are mainly labor intensive one, they provide large scale employment. Govt. should promote these kinds of SEZs to increase the level of employment. SEZs also provide indirect employment by creating ancillary opportunities in industries like transport, communication, automobile, civil aviation, shipping, tourism, hospitality, packaging, banking, and insurance. Employment opportunities are, thus generated for both unskilled and skilled labor in SEZs. In the year 2006-07 total employment was provided to only 178763 persons. In 2008-09 it creased almost 3 times and the employment created was 490358 persons. In the year 2013-1 4 total employments is provided to 1283309 persons which was only 1074904 persons in 2012-13. For the optimum growth of employment by SEZs it is must that SEZs should have balanced regional spread so that balanced regional development can be achieved, and it should encourage manufacturing, agro-based and low-skill oriented units in SEZs so as to help the low-skilled population and those with secondary education get employment. (Singala, Atmavilas, & Singh, 2011). SEZs served India’s economy well in terms of employment generation. From 2011 to 2014 the employment from SEZs increased more than 51 percent; it increased from 844916 in 2011 to 1283309 in 2014.Maharashtra, Tamil Nadu and Karnataka are the top states to provide employment in SEZs (Annexure table-7).SEZs are providing employment but the majorly SEZs are set up to attract export oriented activities which would not otherwise have come up due to poor investment climate and high cost of production in the economy. (Aggarwal A. , 2007) In the above sections it is mentioned that SEZs help in promoting Employment, Exports and Investment. But here attempt has been made to study the relationship among Increase in exports and investment promotion and employment generation. Table 4- shows the results of the Pearson’s coefficient of correlation.
Table 4: Co-efficient of correlation among Exports, Employment and Investment This shows that value of correlation between Exports and Employment is 0.97 and with investment is 0.94. The correlation between investment and employment is showing as 0.95. This table clearly shows that there is very high positive correlation among all these. So increase in exports will also help in employment generation and investment promotion and vice-a-versa. It can be concluded from the above study that SEZs are playing a major role in exports activities. The amount of exports from SEZs has increased rapidly during the study period of 2000-01 to 2013-14.It increased from amount Rs. 8552 crores in 2000-01 to Rs.494077 crores in 2013-14 and recorded a CAGR of 33.16 percent. The regression analysis shows that exports of SEZs play an important role in the exports of India and 95 percent variation in the India’s exports is explained by the variation in the SEZ’s exports. Most of the contribution of exports from SEZs is mainly from the developed states like Gujarat, Tamil Nadu and Karnataka, and the major share of exports are coming from Notified after 2005 act SEZs. SEZs help in employment generation and investment promotion and the correlation between exports, employment and investment is very high. This indicates that due to increase in exports of SEZs employment and investment level increases. Even Prime Minister of India “Mr. Narender Modi” has stated that to achieve the faster growth the states have to compete with one another for export promotion (Reporters, 2014).To create the export driven atmosphere in the country entrepreneurs should be benefited and aware Agrawal & Verma, (2013).So for the growth of SEZs cautious implementation of SEZ policy is needed with equal export capability within zones and multi sector development in the zones. (Lonarkar, 2014)
ANNEXURE TABLE 1- Gross Exports from SEZs in India
ANNEXURE TABLE 2-Share of SEZs Exports in Total India’s Exports REFERENCES :
Evolution of SEZs
SEZ – Global Context
LITERATURE REVIEW
METHODOLOGY
Research Methodology
Co-efficient of Correlation Analysis has been used to study the relationship between change in exports and employment and investment in SEZs. (Nidheesh. K.B, 2013)Export Performance of SEZs
Total Export Performance
Source: Govt. of India, Economic Survey 2009-10, P. 173.
Govt. of India, Ministry of Commerce, Annual Reports, (Various Issues)
ANNEXURE
Source: Compiled from Compiled from Ministry of
Commerce and Industry, Govt. of India.
ANNEXURE TABLE 3- Zone-Wise Export of SEZs
ANNEXURE TABLE 4-State-wise Exports of various SEZs in India
ANNEXURE TABLE 5-Sector wise Exports from SEZs in 2010-11*
*Latest Data is not available for Sector-wise Exports.
ANNEXURE TABLE 6-Employment and Investment provided by SEZs in India
ANNEXURE TABLE 7-State-wise details of Employment by SEZs from 2011-12 to 2013-14
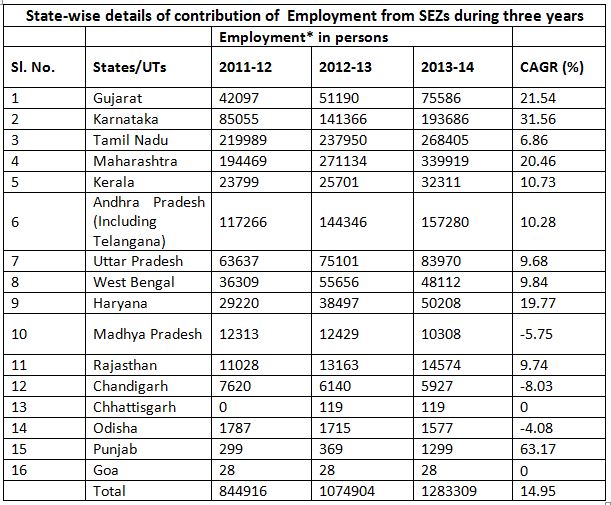
Source: Press Information Bureau Government of India
Ministry of Commerce & Industry www.pib.nic.in
***************************************************
Minakshi Gupta
Prof. Lokmanya College of Commerce, (PhD Research Scholar)
Address- T-202, Venus Parkland,
Nr. Vejalpur police Chowki, Vejalpur,
Ahmedabad-380051


Home | Archive | Advisory Committee | Contact us