Strategic Management in the Global Context: Challanges and Opportunity
Introduction Strategic Objectives Sources of Competitive Advantage EXPORTS & IMPORTS : (US $ Million) (PROVISIONAL) NOVEMBER APRIL-NOVEMBER [Source: www. dipp.nic.in/fdi_statistics/india_FDI_August2010.pdf]
Strategic Management has become a necessity to the corporate entities; and even more essential in the trans-globe corporate management. In the current scenario of small world, mini technology, micro webs and miniature gadgets; taking a strategic call is a very difficult job. The word strategy is large enough to write an epic to the size of million pages. I would like to discuss our focused topic relating to global scenario. Quoting from historic experiences is more relevant before I proceed further, “Going to West was a dream and owing a Western product was a pleasure”. But, with the passage of time and evolution of better means dreams have turned to reality and pleasures have become necessity. Globalization – the ongoing process of greater interdependence among countries and their citizens – is complex and multifaceted process. Many of the problems that the critics of globalization point to are real. Some of them relate to economics. Others relate to non-economic, but no less important, aspects of life. And while some of the problems do stem from the process of global integration, others do not.
As far as the economics is concerned, the big challenge is poverty, and the surest route to sustained poverty reduction is economic growth. Growth requires good economic policies. The evidence strongly supports the conclusion that growth requires a policy framework that prominently includes an orientation towards integration into the global economy. This places obligations on three groups: those who are most responsible for the operation of the international economy, primarily the governments of the developed countries; those who determine the intellectual climate, which includes this audience but also government and non-government organizations and individuals; and the governments of the developing countries who bear the major responsibility for economic policy in their countries.
Globalization is much more than an economic phenomenon. The technological and political changes that drive the process of economic globalization have massive non-economic consequences. In the words of Anthony Giddens, a leading sociologist: “I would have no hesitation in saying that globalization, as we are experiencing it, is in many respects not only new, but also revolutionary. Globalization is political, technological and cultural, as well as economic.”
Global Strategic Management
Strategy plays a vital role in business to survive in global context. Global scenario varies from daily habits to celebrations, market place to lifestyle, dressing patterns to eating habits. If the business cannot create an action plan to capture the market; they will have a hard time to make a hard print of their foot-fall into the market. Strategic changes in business will result only if business is healthy unit to adapting critical situations.
During the last half of the twentieth century, many barriers to international trade fell and a wave of firms began pursuing global strategies to gain a competitive advantage. However, some industries benefit more from globalization than do others, and some nations have a comparative advantage over other nations in certain industries. To create a successful global strategy, managers first must understand the nature of global industries and the dynamics of global competition.
Seeds for Effective Global Strategy
Chart - I
Exploit another country's resources - labor, raw materials
Extend the product life cycle - older products can be sold in lesser developed countries
Operational flexibility - shift production as costs, exchange rates, change over time, etc.
Cross subsidization between countries
Transfer price
Diversify operational risks (labor problems, earthquakes, wars)
Broaden learning opportunities due to diversity of operating environments
Crossover customers between markets - reputation and brand identification
National Differences
Scale Economies
Scope Economies
Efficiency in Operations
Exploit factor cost differences
Scale in each activity
Sharing investments and costs
Flexibility
Market or policy-induced changes
Balancing scale with strategic & operational risks
Portfolio diversification
Innovation and Learning
Societal differences in management and organization
Experience - cost reduction and innovation
Shared learning across activities
DRIVERS FOR GLOBAL COMPETITIVE ADVANTAGE
A global industry can be defined as an industry in which firms must compete in all world markets of that product in order to survive. An industry in which a firm's competitive advantage depends on economies of scale and economies of scope gained across markets. Some industries are more suited for globalization than are others. The following drivers determine an industry's globalization potential.
1. Cost Drivers:
2. Customer Drivers
3. Competitive Drivers
4. Government Drivers
The furniture industry is an example of an industry that did not lend itself to globalization before the 1960's. Because furniture has a high bulk compared to its value, and because furniture is easily damaged in shipping, transport costs traditionally were high. Government trade barriers also were unfavorable. The Swedish furniture company IKEA pioneered a move towards globalization in the furniture industry. IKEA's furniture was unassembled and therefore could be shipped more economically. IKEA also lowered costs by involving the customer in the value chain; the customer carried the furniture home and assembled it himself. IKEA also had a frugal culture that gave it cost advantages. IKEA successfully expanded in Europe since customers in different countries were willing to purchase similar designs. However, after successfully expanding to several countries, IKEA ran into difficulties in the U.S. market for several reasons:
Types of International Strategy: Multi-domestic vs. Global Multi-domestic Strategy
Global Strategy
A fully multi-local value chain will have every function from R&D to distribution and service performed entirely at the local level in each country. At the other extreme, a fully global value chain will source each activity in a different country.
Videocon is a good example of a company that followed a multi-domestic strategy. This strategy resulted in:
The multi-domestic strategy also presented Videocon with many challenges:
ROLE OF INDIA IN GLOBAL CONTEXT:
Global trade flows rebounded strongly in 2010 following their collapse in 2009. The rise in the volume of goods exports in 2010 was the largest on record, enabling world trade to return to its pre-crisis level but not its long-term trend. Economic conditions continued to improve in both developed and developing economies, but the recovery of both trade and output proceeded more slowly in developed countries.
World trade recorded its largest ever annual increase in 2010 as merchandise exports surged 14.5 per cent, buoyed by a 3.6 per cent recovery in global output as measured by gross domestic product (GDP) (see Figure 1). Both trade and output grew faster in developing economies than in developed ones. Exports in volume terms (i.e. in real terms, accounting for changes in prices and exchange rates) were up 13 per cent in developed economies while the increase for developing economies was nearly 17 per cent.
The factors that contributed to the unusually large 12 per cent drop in world trade in 2009 may have also helped boost the size of the rebound in 2010. These include the spread of global supply chains and the product composition of trade compared with output. Global supply chains cause goods to cross national boundaries several times during the production process, which raises measured world trade flows compared with earlier decades.
Although the growth of world exports in 2010 was the highest on record in a data series going back to 1950, it might have been even higher if trade had quickly reverted to its pre-crisis trend. This did not happen. The rebound was strong enough for world exports to recover their peak level of 2008, but it was not strong enough to bring about a return to the previous growth path (see Figure 2).
A number of factors combined to make trade and output grow more slowly than they might otherwise have done. First, curtailment of fiscal stimulus measures in many countries dampened economic activity in the second half of the year.
INDIA’S MARKET SHARE
Exports
India’s exports during November, 2011 were valued at US$ 22321.64 million (Rs.113519.82 crores) which was 3.87 per cent higher in Dollar terms (17.34 per cent higher in Rupee terms) than the level of US$ 21489.49 million (Rs. 96742.01) during November, 2010. Cumulative value of exports for the period April-November 2011 -12 was US$ 192694.38 million (Rs 893094.16 crores) as against US$ 144659.95 million (Rs.661055.88 crores) registering a growth of 33.21 per cent in Dollar terms and 35.10 per cent in Rupee terms over the same period last year.
Imports
India’s imports during November, 2011 were valued at US$ 35922.43 million (Rs.182688.55 crores) representing a growth of 24.55 per cent in Dollar terms (40.70 per cent in Rupee terms) over the level of imports valued at US$ 28842.33 million ( Rs. 129843.26 crores) in November, 2010. Cumulative value of imports for the period April-November, 2011-12 was US$ 309530.45 million (Rs.1435304.79 crores) as against US$ 237664.08 million (Rs. 1085780.54 crores) registering a growth of 30.24 per cent in Dollar terms and 32.19 per cent in Rupee terms over the same period last year.
Crude Oil and Non-Oil Imports:
Oil imports during November, 2011 were valued at US$ 10307.1 million which was 32.28 per cent higher than oil imports valued at US$ 7792.1 million in the corresponding period last year. Oil imports during April-November, 2011-12 were valued at US$ 94116.5 million which was 42.67 per cent higher than the oil imports of US$ 65967.8 million in the corresponding period last year.
Non-oil imports during November, 2011 were estimated at US$ 25615.3 million which was 21.69 per cent higher than non-oil imports of US$ 21050.2 million in November, 2010. Non-oil imports during April - November, 2011-12 were valued at US$ 215413.9 million which was 25.46 per cent higher than the level of such imports valued at US$ 171696.3 million in April - November, 2010-11.
Trade Balance
The trade deficit for April-November, 2011-12 was estimated at US$ 116836.07 million which was higher than the deficit of US$ 93004.13 million during April-November, 2010-11.
EXPORTS(including re-exports)
2010-11
21489.49
144659.95
2011-12
22321.64
192694.38
%Growth2011-12/ 2010-2011
3.87
33.21
IMPORTS
2010-11
28842.33
237664.08
2011-12
35922.43
309530.45
%Growth2011-12/ 2010-2011
24.55
30.24
TRADE BALANCE
2010-11
-7352.84
-93004.13
2011-12
-13600.79
-116836.07
EXPORTS & IMPORTS : (Rs. Crores)
(PROVISIONAL)
NOVEMBER
APRIL-NOVEMBER
EXPORTS(including re-exports)
2010-11
96742.01
661055.88
2011-12
113519.82
893094.16
%Growth2011-12/ 2010-2011
17.34
35.10
IMPORTS
2010-11
129843.26
1085780.54
2011-12
182688.55
1435304.79
%Growth2011-12/ 2010-2011
40.70
32.19
TRADE BALANCE
2010-11
-33101.25
-424724.66
2011-12
-69168.73
-542210.63
Exports by Principal Commodities
Disaggregated data on exports by Principal Commodities, in dollar terms, for the period 2010-11 (April–September) as compared with the corresponding period of the previous year are given in Appendix 2.1 & 2.2. Exports during the period Apr-Dec. 2010-11 registered a growth of 29.5% in US$ terms.
The share of top five principal commodity groups in India’s total exports during 2010-11 (April-September) is given at Chart 2.3.
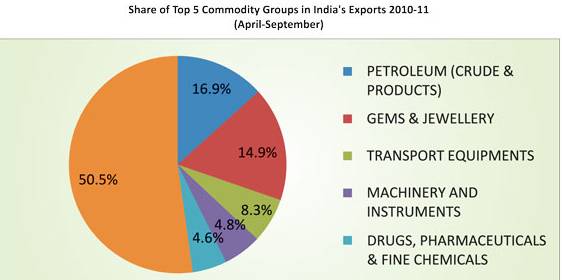
Petroleum & related products dominated exports of India, followed by gems & jewellery, transport equipment with respective share of 14.9% & 8.3%. 50.5% included other goods and services.
Doing Business in India:,
Over the past decade the Indian Economy has witnessed a paradigm shift and is on a robust growth trajectory. The Indian economy today boasts of a burgeoning annual growth rate, deep capital markets and liberalised foreign direct investment (FDI) regime.
India is one of the few economies to have weathered the recent global financial crisis and its gross domestic product (GDP) has been growing and will continue to grow in excess of 8 per cent per year. The country's GDP has been growing at an average rate of 8.6 per cent for the last five years. India's GDP growth projection is 8.5 per cent for FY11.
India’s economy has strong fundamentals and is host to several eminent global corporate giants that are leaders in their respective fields. According to the Global Competitiveness report 2010-11, India ranks 51st among 139 countries. India ranks higher than many countries in key parameters such as market size (4th) and innovation (39th). It also has a sound financial market (17th).
According to UNCTAD's World Investment Prospects Survey 2010-2012, India is the second-most attractive destination for FDI in the world. Indian markets have significant potential and offer prospects of high profitability and a favourable regulatory regime for investors.
Emerging from the grip of a crippling recession, world trade is set to surge by 13.5 per cent in 2010, with a resurgent India contributing over half a trillion dollars to global commerce for the first time in history. With global trade coming out of a "painful economic recession" in 2009, India's merchandise engagement with the world -- both imports and exports -- picked up pace in the 2010-11 fiscal after a rather lack-luster performance in the previous year.
The value of India's inbound and outbound trade in goods is set to touch USD 550 billion in the 2010-11 fiscal, with imports expected to touch USD 350 billion, as against USD 288 billion in the 2009-10 fiscal.
"Following a faster-than-expected recovery in global trade flows so far in 2010, WTO economists have revised their projection for world trade growth in 2010 upward to 13.5 per cent," a WTO report said.
Making out a strong case against protectionism, World Trade Organisation (WTO) Director General Pascal Lamy said: "This surge in trade flows provides the means to climb out of this painful economic recession and can help put people back to work. It underscores, as well, the wisdom governments have shown in rejecting protectionism."
India stood out among other countries during the year in terms of its open trade policies, as is evident from the huge trade deficit of USD 120-130 billion projected for the current financial year.
The restrictive trade policies adopted by India's larger neighbour, China, stood out in sharp contrast. The past year witnessed an escalating currency war between the US and China, with Washington urging Beijing to allow the Yuan to rise, claiming that the Chinese currency was artificially depressed in order to create an unfair trade advantage.
However, the US has been accused of doing the same thing, following an announcement in November that the Federal Reserve will purchase Treasury Securities to infuse USD 600 billion into the struggling economy by June, 2011. This would be achieved by printing more dollar bills, thereby lowering the value of the currency.
What is more, the US has taken an increasingly protectionist stance against outsourcing to countries like India, with the state of Ohio imposing a ban on state departments awarding work orders to overseas IT companies. Furthermore, a controversial legislation to beef up security along the US-Mexico border by hiking the cost of visas sought after by overseas professionals also attracted criticism.
India's share in merchandise world trade rose from 0.7% in 2000 to 1.4% in 2010, making it the 20th largest exporter in the world, according to the WTO's 'World Trade Report 2011'. Amongst other things, the rising share in world trade can be attributed to a shift towards better quality and high-value products - a strategy that has helped it grow alongside China in the array of products the emerging powers sell to the richer nations.
We do not compete with China, rather we complement each other. We focus on different product lines. India does well in the medium and upper end of the market, while china does well in the lower end, where they charge low prices.
Asia's third-largest economy also enjoys an advantage over China in terms of services related to these manufactured goods, which helps in differentiating products. In fact, even China is increasingly becoming an important export destination for Indian goods. In 2010-11, China was the largest importer of Indian engineering goods at $5631.66 million (April-Jan).
Global Trade Relations
Since liberalisation, the value of India's international trade has increased sharply, with the contribution of total trade in goods and services to the GDP rising from 16% in 1990–91 to 43% in 2005–06. India's major trading partners are the European Union, China, the United States and the United Arab Emirates. In 2006–07, major export commodities included engineering goods, petroleum products, chemicals and pharmaceuticals, gems and jewellery, textiles and garments, agricultural products, iron ore and other minerals. Major import commodities included crude oil and related products, machinery, electronic goods, gold and silver. In November 2010, exports increased 22.3% year-on-year to 85,063 crores (US$16.16 billion), while imports were up 7.5% at 125,133 crores (US$23.78 billion). Trade deficit for the same month dropped from 46,865 crores (US$8.9 billion) in 2009 to 40,070 crores (US$7.61 billion) in 2010.
Hospitality
Travel and Tourism is one of the largest industries globally both in terms of Size and employment. The sector accounts for 9.4% of the global GDP and 9% of employment. Even in India, Travel and Tourism is a very important industry accounting for 6% of the GDP and 9% of employment. However, in the global context, India is still a nascent market, with the Indian travel and tourism industry accounting for less than 2% of global tourism spends. India is the second most populous country in the world, and is a key growth engine for the global economy. With a cultural heritage and diversity which only a few countries can match, there is significant headroom for growth of this sector in India.
Share of Top five investing countries in FDI inflow:
Table 1
Share of top five investing countries in FDI inflows. (2000–2010)
Rank
Country
Inflows
(million USD)Inflows (%)
1
Mauritius
50,164
42.00
2
Singapore
11,275
9.00
3
USA
8,914
7.00
4
UK
6,158
5.00
5
Netherlands
4,968
4.00
CONCLUSION:
Growth requires good economic policies. The evidence strongly supports the conclusion that growth requires a policy framework that prominently includes an orientation towards integration into the global economy. Strategy plays a pivotal role in business to survive at global level. Global scenario varies from daily habits, lifestyle, standard of living, income level etc. If the business cannot create an action plan to capture the market; they will have a hard time to make a hard print of their foot-fall into the market. Strategic changes in business will result only if business is healthy unit to adapting critical situations and environmental changes.
***************************************************
Dr. A. K. Chakrawal
Coordinator, Internal Quality Assurance Cell, Saurashtra University, Rajkot – 360 005 (Gujarat) India
iqac@sauuni.ernet.In
and
Professor, Department of Commerce and Business Administration, Saurashtra University, Rajkot – 360005 (Gujarat) India
alochak@Gmail.Com


Home | Archive | Advisory Committee | Contact us