Financial Analysis of Navratnas Companies
Abstract ::
The government of India established various companies and corporations to achieve the industrial production and improve the overall economy. However some enterprises performed extraordinary while some were not able to even perform well. Hence government came up with the concept of Navratnas (9 most prestigious companies).This study deals with a study of productivity and financial efficiency of these Navratnas companies of India. The major sectors of these companies are mining, coal, power generation, oil and gas and social services. This study conducts for the year 2007-08 to 2011-12.Researchers evaluates the productivity and financial efficiency with the help of various ratios. Researchers have used secondary data to conduct comparative analysis of efficiency across various industries. This study aimed a exploring various types of financial efficiency of Navratnas companies in India.
Key Words:- Navratnas, Miniratna, financial efficiency.
Introduction ::
Public sector undertaking is a term used for a government -owned corporation. The term is used to refer to the companies in which the government owns a majority (51% or more) of the company equity. A public sector enterprise is a corporation where management control of the company rests with the government; it can be central government or the state governments. Prior to 1947, there was no “Public sector” in the Indian economy. The only instances worthy of mention were the railways, the posts and telegraphs, the port trusts and Aircraft factories and a few state managed undertakings like the government salt factories etc. The idea that economic development should be promoted by the state actually managing industrial concerns did not take root in India before 1947. However in the post independence period the expansion of public sector was undertaken as an integral part of the 1956 industrial policy.
Post – independence Indian economy faced many ups and downs. The focus on industrial output in the second five year plan (1956-61) drove huge investment in the industrial sector. The economy saw production rising and new investments made. The government investment was seen heavily in the building of infrastructure facilities. The various tasks of the second five year plan in India were:
1. To increase by 25% the national income
2. To make the country more industrialized
3. To increase employment opportunities so that every citizen gets a job
During the second five year plan India, 5 steel plants had been established, apart from a hydro-electric power project which was also undertaken and implemented. The production of coal increased during this period. Also more railway lines were added in the north-east part of the country, during the Indian second five year plan.
The industrial policy resolution 1956 gave the public sector a strategic role in the Indian economy, for one thing at the time of independence the country was backward and underdeveloped basically an agrarian economy with a weak industrial base, heavy unemployment, low level of savings and investment and near absence of infrastructural facilities, Indian economy needed a big push.
Navratna was the title given originally to nine Public Sector Enterprises, identified by the Government of India in 1997 as its most important, which allowed them greater autonomy to compete in the global market. The member of PSEs having Navratna status has been raised to 16, the most recent addition being Neyyeli Lignite Ltd. To be qualified as Navratna, the company must obtain a score of 60. the score is based on parameters which include net profit to net worth, total manpower cost to total cost of production or cost of services, Profit before Depreciation, Interest and Taxes(PBDIT) to capital employed, PBIT to turnover, earning per Share(EPS) and interest sector performance. Additionally, a company must first be a Miniratna and must have four independent directors on its board before it can be a Navratna.
“The Navratna status will empower a company to invest up to Rs.1000cr or 15% of their net worth on a single project without seeking government approval. In a year these companies can spend up to 30% of their net worth not exceeding Rs. 1000cr. They will also have the freedom to enter joint ventures, from alliances and float subsidiaries abroad.”
Navratna
The government of India established various companies and corporations to achieve the industrial production and improve the overall economy. The major sectors as described earlier were the mining and industry, power generation, social services, etc. the overall economy showed tremendous improvement but with hick ups. However the efficiency of performance of these entities was under question. Some enterprises performed extraordinarily while some were not able to even perform well. Hence the government came up with the concept of NAVRATNAs under this the government identified 9 companies in 1997 as its crown jewels or the most prestigious PSUs, which allowed them greater autonomy to compete in the global market. The following are the original 9 companies with brief details of each
Bharat Heavy Electrical Limited (BHEL)
BHEL is an integrated power plant equipment manufacturer and one of the largest engineering and manufacturing companies in India in terms of turnover. It is established in 1964, ushering in the indigenous Heavy Electrical Equipment industry in India - a dream that has been more than realized with a well-recognized track record of performance. The company has been earning profits continuously since 1971-72 and paying dividends since 1976-77. BHEL is engaged in the design, engineering, manufacture, construction, testing, commissioning and servicing of a wide range of products and services for the core sectors of the economy, viz. Power, Transmission, Industry, Transportation (Railway), Renewable Energy, Oil & Gas and Defense. It have 15 manufacturing divisions, two repair units, four regional offices, eight service centers and 15 regional centers and currently operate at more than 150 project sites across India and abroad.
Table – 1 BHEL
|
Mar '12 |
Mar '11 |
Mar '10 |
Mar '09 |
Mar '08 |
| Net Profit Margin (%) |
14.36 |
13.99 |
12.55 |
11.36 |
13.87 |
| Return On Capital Employed (%) |
40.27 |
44.25 |
41.37 |
36.95 |
41.56 |
Source: Annual report of company
From above data it is observe that the net profit margin of BHEL is increase from 13.87% to 14.36% during last five years. Return on capital employed is highest in the year March 2011 at 44.25%. So performance of BHEL is good during last 5 years.
Steel Authority of India Limited (SAIL)
SAIL is the leading steel-making company in India. It is a fully integrated iron and steel maker, producing both basic and special steels for domestic construction, engineering, power, railway, automotive and defense industries and for sale in export markets.
SAIL manufactures and sells a broad range of steel products, including hot and cold rolled sheets and coils, electrical sheets, railway products, plates, bars and rods, stainless steel and other alloy steels. SAIL produces iron and steel at five integrated plants and three special steel plants, located principally in the eastern and central regions of India and situated close to domestic sources of raw materials, including the Company's iron ore, limestone and dolomite mines. The company has the distinction of being India’s second largest producer of iron ore and of having the country’s second largest mines network.
Table – 2 SAIL
|
Mar '12 |
Mar '11 |
Mar '10 |
Mar '09 |
Mar '08 |
| Net Profit Margin (%) |
7.5 |
11.25 |
15.93 |
13.55 |
18.26 |
| Return On Capital Employed (%) |
11.06 |
13.03 |
20.29 |
26.92 |
42.76 |
Source: Annual report of company
It is observe form the Table – 2 that the Net profit margin as well as the return on capital employed is fall eventual during last five years. Net profit margins reduce from 18.26% in March 2008 to 7.5% in March 2012, while return on capital employed is reduce to 11.06% in March 2012 from 42.76% in March 2008.
Gas Authority of India Limited (GAIL)
GAIL (India) Ltd was incorporated in August 1984 as a Central Public Sector Undertaking (PSU) under the Ministry of Petroleum & Natural Gas (MoP&NG). It was one of the largest cross-country natural gas pipeline projects in the world. Originally this 1800 Km long pipeline was built at a cost of Rs 1700 Crore and it laid the foundation for development of market for natural Gas in India. GAIL, build large network of Natural Gas Pipelines covering over 9500 Km with a capacity of around 172 MMSCMD; two LPG Pipelines covering 2040 Km with a capacity of 3.3 MMTPA of LPG; seven gas processing plants for production of LPG and other Liquid Hydrocarbons, with a production capacity of 1.4 MMTPA; and a gas based integrated Petrochemical plant of 410,000 TPA polymer capacity which is further being expanded to a capacity of 900,000 TPA. The Company also has 70% equity share in Brahmaputra Cracker and Polymer Limited (BCPL) which is setting up a 280,000 TPA polymer plant in Assam.
Table – 3 GAIL India
|
Mar '12 |
Mar '11 |
Mar '10 |
Mar '09 |
Mar '08 |
| Net Profit Margin (%) |
9.94 |
11.27 |
12.05 |
11.16 |
14.39 |
| Return On Capital Employed (%) |
18.79 |
21.93 |
22.04 |
22.76 |
23.96 |
Source: Annual report of company
From the Table 3 it is observe that both net profit margin and return on capital employed of GAIL India have reduced during last five years. Net profit margin reduced from 14.39% in March 2008 to 9.94% in March 2012. Return on capital employed reduced from 23.96% during March 2008 to 18.79% in March 2012.
Hindustan Petroleum Corporation Limited (HPCL)
HPCL is a Government of India Enterprise with a Navratna Status, and a Fortune 500 and Forbes 2000 company, with an annual turnover of Rs. 1,69,011 Crores and sales/income from operations of Rs 1,88,130 Crores (US$ 36.975 Billions) during FY 2011-12, having about 20% Marketing share in India among PSUs and a strong market infrastructure. HPCL's Crude Thru put and Market Sales (including exports) are 16.19 Million Metric Tons (MMT) and 29.48 MMT respectively in the same period.
HPCL operates 2 major refineries producing a wide variety of petroleum fuels & specialties, one in Mumbai (West Coast) of 6.5 Million Metric Tons Per Annum (MMTPA) capacity and the other in Vishakhapatnam, (East Coast) with a capacity of 8.3 MMTPA. HPCL holds an equity stake of 16.95% in Mangalore Refinery & Petrochemicals Limited, a state-of-the-art refinery at Mangalore with a capacity of 9 MMTPA.
HPCL, over the years, has moved from strength to strength on all fronts. The refining capacity steadily increased from 5.5 MMTPA in 1984/85 to 14.8 MMTPA presently. On the financial front, the turnover has grown from Rs. 2687 Crores in 1984-85 to an impressive Rs 1,69,011 Crores in FY 2011-12.
Table – 4 HPCL
|
Mar '12 |
Mar '11 |
Mar '10 |
Mar '09 |
Mar '08 |
| Net Profit Margin (%) |
0.09 |
1.22 |
1.31 |
0.58 |
1.23 |
| Return On Capital Employed (%) |
6.37 |
8.02 |
9.61 |
8.58 |
7.22 |
Source: Annual report of company
From the table 4 it is observe that the net profit margins is negligible in March 2012 at just 0.09% and return on capital employed is 6.37% in the same year.
Bharat Petroleum Corporation Ltd (BPCL)
On 24th January 1976, the Burmah Shell Group of Companies was taken over by the Government of India to form Bharat Refineries Limited. On 1st August 1977, it was renamed Bharat Petroleum Corporation Limited. It was also the first refinery to process newly found indigenous crude (Bombay High), in the country.
BPCL produces a diverse range of products, from petrochemicals and solvents to aircraft fuel and specialty lubricates and markets them through its wide network of petrol stations, LPG distributers, Lube shopper.
Table – 5 BPCL
|
Mar '12 |
Mar '11 |
Mar '10 |
Mar '09 |
Mar '08 |
| Net Profit Margin (%) |
0.39 |
1.12 |
1.29 |
0.45 |
1.71 |
| Return On Capital Employed (%) |
9.03 |
10.13 |
11.84 |
14.42 |
12.24 |
Source: Annual report of company
From the table 5 it can be observe that Net profit margin and return on capital employed is constantly reducing, in March 2008 net profit margin is 1.71% and return on capital employed is 12.24% which reduced to 0.39% and 9.03% respectively in March 2012.
Indian Oil Corporation Limited (IOCL)
Indian Oil corporation Ltd. Is India’s largest company by sales with a turnover of Rs. 409957 crore and profit of Rs 3955 crore for the year 2011-2012.
IOCL is the highest ranked Indian company in the latest Fortune Global 500 listings, ranked at the 83rd position. Indian oil’s vision is driven by a group of dynamic leaders who have made it a name to reckon with. IOCL has set up subsidiaries in Srilanka, Mauritius and United Arab Emirates and is simultaneously scouting for new business opportunities in the energy markets of Asia and Africa.
Table –6 IOCL
| IOCL |
Mar '12 |
Mar '11 |
Mar '10 |
Mar '09 |
Mar '08 |
| Net Profit Margin (%) |
1.02 |
2.47 |
4.15 |
0.89 |
3.39 |
| Return On Capital Employed (%) |
12.83 |
10.81 |
15.74 |
14.2 |
16.04 |
Source: Annual report of company
From the table 6 it is observe that net profit margin and return on capital employed both have reduced, in March 2008 net profit margin was 3.39% which have reduced to 1.02% in March 2012.
Oil and Natural Gas Corporation Limited (ONGC)
ONGC is an Indian multinational oil and gas company. It is one of the largest Asia-based oil and gas exploration and production companies, and produces around 77% of India's crude oil(equivalent to around 30% of the country's total demand) and around 81% of its natural gas. It is one of the largest publicly traded companies by market capitalization in India. ONGC has been ranked 357th in the Fortune Global 500 list of the world's biggest corporations for the year 2012. It is also among the Top 250 Global Energy Company by Platts.
ONGC was founded on 14 August 1956 by the Indian state, which currently holds a 69.23% equity stake. Its international subsidiary ONGC Videsh currently has projects in 15 countries.
On 11 August 2012, ONGC announced that it had made a large oil discovery in the D1 oilfield off the West coast of India, which will help it to raise the output of the field from around 12,500 barrels per day (bpd) to a peak output of 60,000 bpd.
In November 2012, ONGC Videsh agreed to acquire ConocoPhillips' 8.4% stake in the Kasha an oilfield in Kazakhstan for around US$5 billion, in ONGC's largest acquisition to date.
Table –7 ONGC
|
Mar '12 |
Mar '11 |
Mar '10 |
Mar '09 |
Mar '08 |
| Net Profit Margin (%) |
18.5 |
18.16 |
18.34 |
18.08 |
19.65 |
| Return On Capital Employed (%) |
26.42 |
37.32 |
23.7 |
32.64 |
39.25 |
Source: Annual report of company
Table 7 shows that both net profit margin and return on capital employed of ONGC is better than other competitors of the same industry.
Mahanagar Telephone Nigam Limited (MTNL)M
MTNL was set up on 1st April, 1986 by the Government of India to upgrade the quality of telecom services, expand the telecom network, and introduce new services and to raise revenue for telecom development needs of India key metros Delhi, the political capital and Mumbai, the financial capital of India.
Table – 8 MTNL
| MTNL |
Mar '12 |
Mar '11 |
Mar '10 |
Mar '09 |
Mar '08 |
| Net Profit Margin (%) |
-111.07 |
-68.79 |
-60.71 |
3.93 |
7.24 |
| Return On Capital Employed (%) |
-25.34 |
-16.41 |
-35.66 |
3.39 |
6.34 |
Source: Annual report of company
Table 8 provides information about net profit margin and return on capital employed of MTNL. It can be observed that net profit margin and return on capital employed both are not only reducing but gone in to negative.
National Thermal Power Corporation (NTPC)
India’s largest power company, NTPC was set up in 1975 to accelerate power development in India. NTPC is emerging as a diversified power major with presence in the entire value chain of the power generation business. Apart from power generation, which is the mainstay of the company, NTPC has already ventured into consultancy, power trading, utilization and coal mining. NTPC ranked 337th in the ‘2012, Forbes Global 2000’ ranking of the World’s biggest companies. NTPC became a Maharatna company in May, 2010, one of
the only four companies to be awarded this status.
The total installed capacity of the company is 39,674 MW (including JVs) with 16 coal based and 7 gas based stations, located across the country. In addition under JVs, 7 stations are coal based & another station uses naphtha/LNG as fuel. The company has set a target to have an installed power generating capacity of 1,28,000 MW by the year 2032. The capacity will have a diversified fuel mix comprising 56% coal, 16% Gas, 11% Nuclear and 17% Renewable Energy Sources(RES) including hydro. By 2032, non fossil fuel based generation capacity shall make up nearly 28% of NTPC’s portfolio.
NTPC has been operating its plants at high efficiency levels. Although the company has 17.75% of the total national capacity, it contributes 27.40% of total power generation due to its focus on high efficiency
Table – 9 NTPC
|
Mar '12 |
Mar '11 |
Mar '10 |
Mar '09 |
Mar '08 |
| Net Profit Margin (%) |
14.25 |
15.57 |
17.26 |
17.01 |
17.94 |
| Return On Capital Employed (%) |
11.43 |
12.86 |
13.64 |
11.77 |
14.74 |
Source: Annual report of company
From Table 9 it is observe that net profit margin and return on capital employed is reduce, in march 2008 net profit margin is 17.94% which reduce to 14.25% in March 2012. While return on capital employed reduced from 14.74% in March 2008 to 11.43% in March 2012
Ratio Analysis
The importance of ratio analysis is derived from its usefulness as a tool for the assessment of the state of a business by the owners, prospective investors, and people and institutions who may be considering lending money to the business. Ratio analysis is used to calculate or analyze the financial statements generated from a company in a given period. This information is invaluable in terms of its use as an indicator of the position of a company in a competitive financial market.
A) Liquidity Ratio
Liquidity is a crucial factor for any business success. It enables the company to honor its short term commitments. These ratios show company’s efficiency in managing its cash and other short term resources.
Current Ratio
The current ratio is a common test of liquidity. It looks at the level of current assets available to meet current liabilities. Short-term creditors prefer a high current ratio since it reduces their risk. On the other hand, Owners prefer a lower current ratio, so that more of the firm’s assets are working to grow the business. As a rule of thumb, the current ratio should be in the region of two or better.

Quick Ratio
Creditors often question the liquidity of a firm’s trading stock. They reason that since trading stock is two steps away from cash it should not be considered available to pay bills, which are immediately due. They may prefer, therefore, to use the quick ratio in which trading stock is subtracted from the current assets.

Chart -1A
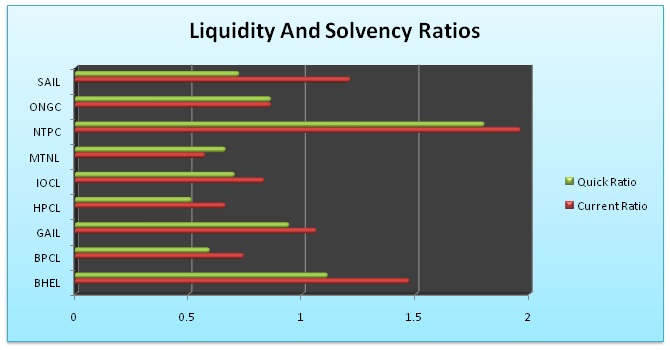
Sources: Annual Reports and Accounts of respective companies.
Chart 1A represents the liquidity and solvency position of Navratan companies, liquidity position of NTPC is highest as compare to other companies while lowest solvency position out of these companies is of MTNL
B) Profitability Indicator Ratio
Profit is among the major objective for any business to survival and hence drives the work efficiently to increase its profitability. Profits are the moral boosters for all the stakeholders in the organization.
Net Profit Margin
The Net Profit Margin can vary significantly from one type of business to another. Try to obtain your industry averages to compare your businesses performance relative to similar firms.Net profit is the prime reason for the very existence of the businesses.
The life span of most businesses is very limited in the absence of good and continues net profits. A Business with continues net losses will soon experience cash flow problems, followed by bankruptcy.
Businesses with a poor profit history will find it difficult and very expensive to borrow money. Net profits need to be ploughed back into the business in order, for it to grow in the future. A business valuation (should you one day wish to sell) is often determined by the volume and consistency of the net profits over the past few years.

Return on Capital Employed
Ccompare the earning capacity of the owner’s investment in the business, with the returns that could be earned from alternative investments, adjusted for risk.
The owner would expect to earn between 5% and 20% more on his investment in the business, than, if he had invested the equivalent money in say blue chip shares.
Most businesses employ some form of borrowing or trade credit, so that Return on Owner’s Equity is influenced by the extent to which the firm borrows or leverages on the owner’s equity. Leveraged businesses are more profitable when earnings are positive, but they are also exposed to greater losses when earnings are negative.

Return on Assets
Return on assets tries to measure the recovery of investment in fixed assets from the net profit
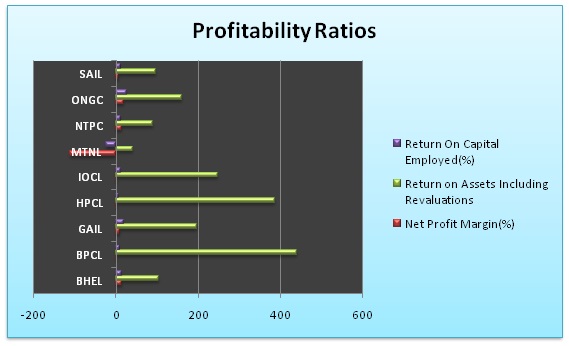
Sources: Annual Reports and Accounts of respective companies.
Chart -1B profitability of the Navratan companies, in this chart return on capital employed is highest of ONGC and negative in case of MTNL, while return on assets is highest in BPCL and lowest in MTNL. Net profit margin of ONGC is highest and MTNL is negative.
C) Debt Ratio
Debt ratio shows how much of total capital employed, it is the proportion of debt. In other words it shows what proportions of the company’s assets are owned by the long term secured and unsecured loans.
Interest Cover
To determine how easy a company can pay the interest on its outstanding debt. The lower the ratio the greater the debt burden on the company. An interest cover of 2 and greater is considered good. An interest cover of 1.5 to 2 is average. An interest cover of 1 to 1.5 indicates some weakness and requires attention. An interest cover below 1 is insufficient to cover ongoing finance expenses and would be of grave concern to lenders.

Debt-Equity Ratio
Debt to equity ratio helps an analyst to analyze what is the portion of long term debts as compared to equity funding. It helps us to understand the extent investment of debt for each unit of equity investment.

Chart 1C
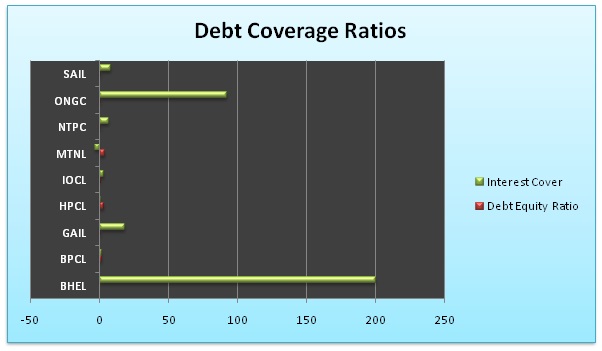
Sources: Annual Reports and Accounts of respective companies.
Chart 1C shows debt coverage ratios, interest coverage ratio of BHEL is highest (200.25) wile negative in case of MTNL (-3.25). Debt equity ratio of MTNL (3.81) poor and ONGC (0.11) which shows there is less debt obligation of this company .
D) Operating performance ratio
This ratios show the operation efficiency of the company. The better the efficiency means a better operation hence better profitability.
Debtor Turnover Ratio
Measure how quickly the business collects its trade debtors. A high ratio indicates the company is having problems getting paid. Outstanding Debtor days should be in line with credit terms granted to account customers. Extended Debtor days is a drain on much needed cash flow and a possible threat to profitability in the form of bad debts and / or settlement claims.

Inventory Turnover Ratio
It measure on average, how many days it takes to convert your stock to sales. The higher the ratio, the slower the stock is being turned over. It is a good idea to monitor the ratio over consecutive financial periods to determine if a trend is developing. A low ratio may indicate positive factors such as good stock demand and management.

Fixed Asset Turnover
It mmeasure how hard the firm’s total asset base is working to generate sales. The greater the Asset Turnover ratio, the more efficient the assets are in generating sales. The best way of judging the ratio is to look at the range of other successful companies in the industry.

Chart -1D
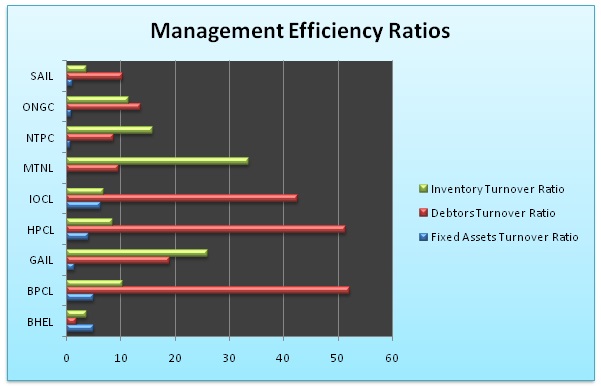
Sources: Annual Reports and Accounts of respective companies.
The chart 1D represent the management efficiency, the inventory turnover ratio is higher in the case of BPCL while Lowest in the case of SAIL. Debtor turnover ratio is highest in MTNL and lowest in BHEL. Fixed assets turnover ratio is highest in IOCL and Lowest in MTNL
E) Other Ratios
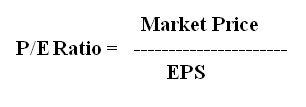
PE Ratio
Price to earnings per share (PE) ratio is an important ratio used for various types of valuation. The PE ratio is the most widely used mode of valuation. The company’s PE shows how much is the value of its earnings appreciated by the market price.
Dividend Pay Out Ratio
The dividends are a part of profits that are disbursed by the company to its shareholders so as to keep them satisfied as well as use the excess liquidity in a proper way. The dividend for the company shows its confidence in its activities and future returns.

Chart 1E
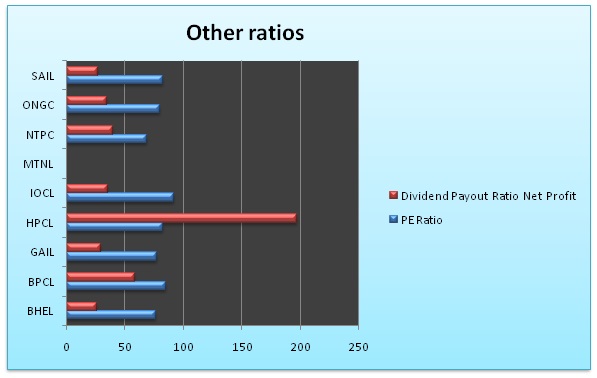
Sources: Annual Reports and Accounts of respective companies.
Chart 1E shows two ratios, PE ratio of IOCL is highest and lowest in NTPC. Dividend payout ratio is highest in HPCL and Lowest in BHEL.
CONCLUSION
The study is made to analyze financial efficiency of various activities in different areas of operation of an organization. In the interest of getting good working results, every enterprise should have a periodical analysis of its performance of efficiency. The areas of the analysis are, financial efficiency, and productivity. For that the conceptual framework for this research is Study of Financial Efficiency of Navratnas in India. The objective of this study is detailed cause and effect study of the efficiency and effectiveness in the use of resources available in the business enterprise. The importance and usefulness of operational efficiency and financial efficiency analysis are different for various users like Financial managers, investor, and shareholders, creditors, employees, Big Business Houses, Government, Society etc. For Financial managers this study is devised to measure the overall effectiveness of their own plans and policies. Investors and Shareholders are interested in the current and long term profitability of their investment. The employees, Shareholders, and Government are interested in the profits of a company. The society also expects to know about the social performance such as environmental obligations, employment, avenues, Social welfare etc. The techniques, which are commonly used for the study, are such as ratio analysis, trend analysis, comparative statement analysis etc.
As regards this ratio the ONGC, IOCL, HPCL, BHEL, SAIL and BPCL showed good profitability. This analysis shows MTNL’s performance is reduces drastically during last five years.
REFERENCES :
- Mohanty R.P. in his articles “ managing technology for strategic advantages ”, The Economics Times, (Thursday 9th jan.1992), p.14
-
Thomas.K. Connell, How to Improve Human Performance (new York: Harper and row, 1978), p.3
-
Brahmananda, P.R, productivity in the Indian Economy. (Bombay: Himalaya publishing House, 1982).
-
Vades Fabricant’s introduction to J.W Kendrick’s Productivity Trends In The United States, (New York: N.B.E.R.1961), P.26
-
Agrawal, M.D. Efficiency Of Public Enterprise in India, (Jaipur: Prateekha Publication.1987), P.206
-
The Economics Times, (Thursday 9th jan.1992), p.13 A Study of Productivity and Financial Efficiency of Textile Industry of India 203
-
Srivastava, J.P. Labour productivity, (new Delhi: oxford and I.H.B Publishing co.1982), p.35
-
Gordan, K.C. Chenand Robert E. Mcgarrah, productivity management, (Chicago: The Dryden press, 1982), p.3
-
Prasad, N.K., Cost accounting. (Calcutta: Book syndicate private ltd, 1979), pp, 20-25.
-
Robert. Anthony and Glenn. A Weisch, Management accounting, (House wood Illinois: Richard D. Irwin, 1977), pp.402-403
-
Ivison Stewart “Productivity measurement and the accountant” management accounting, London, vol.60 no.9, October 1982,p. No 20-23
-
Jain A and Jain N. “An integrated approach to inventory management” Journal of accounting and Finance.Jaipur, Vol.12, No.2, Sep.1998, P.No.166
***************************************************
Patel Pravin R
Principal
Gujarat Commerce College
Ahmedabad.
|