Bibliometric Analysis of the “Indian Journal of Marketing” from 2010-2014
Abstract : In this electronic era there is awareness of the advantages of quantitative evaluation. The science is concerned that bibliometric indicators are must for evaluation of document, file or any text. In this paper, I will begin with a brief history of bibliometrics, to trace its origins and define its role in the evaluation of articles. We shall present a variety of bibliometric indicators, noting their uses and their limitations. The aim of this study is to highlight both the strengths and weaknesses of bibliometric indicators. Bibliometrics is a tool by which the state of science and technology can be observed through the overall production of literature. Bibliometrics can be an aid to decision-making and research management. Bibliometric indicators are practical tools which can be used in combination with other indicators. Each indicator has its advantages and its limitations and care must be taken not to consider them as “absolute” indices.
KEYWORDS:
Bibliometric, Citation Analysis, Authorship, Citation
Intoduction:
The Bibliometric is a research method mostly used in library and information science and is a quantitative study of various aspects of literature on a topic. It is used to identify the pattern of publication, authorship and the secondary journal coverage to gain insight into the dynamics of growth of knowledge in the areas under the consideration. Pritchard coined a new term “bibliometrics” in 1969. Bibliometrics was defined as the application of mathematical and statistical methods to books and journal articles. Bibliometrics has a specific measurements and indicators and purpose is to measure the output of scientific and technological research through data.
Bibliometric techniques have evolved over time and are continuing to do so the counting of papers with attribution by geographical area, by institution and by author. The counting of citations, to measure the impact of published work on the scientific community; the counting of co-citations; the number of times that two papers are cited together in a single paper etc. All these techniques combine to give more detailed and more effective measurements and the results are presented in various forms, like that mapping, in order to depict the relationships between participants and expand the means for analysis of documents. Dr. S.R. Ranganathan, library science scientist coined the term “librametry” in 1948. It is historically appeared first and was intended to streamline the services of librarianship. Bibliometrics is equivalent to Ranganathan’s librametrics; the Russian concept scientometrics; infometrics; webometrics and subdisciplines like econometrics; psychometrics; sociometrics; biometrics; technometrics; chemometrics; and climetrics; where mathematics and statistics are applied to study and solve problems in their respective fields. Scientometrics is used for the application of quantitative methods to the history of science and overlaps with bibliometrics to a considerable extent.
DEFINITION:
Some definitions of bibliometrics are given below:
- Pritchard says that “all studies which seek to quantify processes of written communication”.
- Fairthorne says that “the quantitative treatment of the properties of recorded discourse and
behavior pertaining to it”.
THE NEED TO EVALUATE RESEARCH
The periodicals are the indicators of literature growth in the field of knowledge and it is emerge as the main trace for transmit knowledge. Because of to the escalating cost of the periodicals and lack of adequate library budgets the selection of any particular periodical for a library should be done more carefully. That’s why the library authorities are forced to reduce the number of periodical subscriptions. Bibliometric analysis has huge applications in the LIS filed in identifying the research trends in the subject, core journals, etc. so that the frame new subscription policies develop for day before. These studies will be helpful for librarians to plan a better collection development in their library.
BIBLIOMETRIC DATABASES:
The different types of databases are mentioned below. The source for bibliometrics is always a database.
- Chemical Abstracts: It is special database of physics and chemistry database and it is produced by an American company, Chemical Abstracts Services, for the American Chemical Society.
- Compendex: It is a special database of engineering and technology database. It is produced by an American company, Engineering Information.
- Embase: It is a special database of medical sciences database. It is produced by a Dutch company,Excerpta Medica.
- Inspec: It is a special database physical sciences database. It is produced by the Institute of Electrical Engineers in the United Kingdom.
- Pascal: It is a general database covering several fields. It is produced by the Institute for Scientificand Technical Information (INIST) at France’s National Centre for Scientific Research (CNRS),
- Science Citation Index: It is a multidisciplinary database. It is produced by a US concern, the Institute for Information Science.
These databases are usually available online and/or on CD-ROM. Each database has its own content and entry criteria. All users of bibliometric indicators must therefore begin by choosing the databases best suited to their particular needs; to do so, they must first analysis the strengths, and limitations of the various databases of bibliometric. Bibliometric analysis uses numerous parameters, such as scientific literature (articles, etc.), co-authorship, patents, citations, co-citations and co-words and these parameters are indirect measures of articles.
Journal “INDIAN JOURNAL OF MARKETING”:
The Journal “INDIAN JOURNAL OF MARKETING” (ISSN 0973-8703) is a double blind peer reviewed refereed monthly journal, it was started in 1968. It is the very oldest and the only monthly journal of Marketing in the India. It is an authentic for research publication dealing with Marketing; Advertising; Consumer Behaviour; Sales Management; Advertising & Promotion Management; Business Education; Business Information Systems (MIS); Business Law; Communication; Direct Marketing; Global Business; Health Care Administration; Marketing Research; Marketing Theory & Applications; Office Administration/Management; Organizational Development; Production/Operations; Public Administration; Retailing; Sales/Selling; Services; Tourism, Hospitality and Leisure; and Industrial Organization.
The Journal “Indian Journal of Marketing” is disseminating knowledge. It is ensures good practice of professional marketing. It is encouraging research and thinking and attempts to contribute to a better perception of marketing theories and its framework and resources and structures and systems and processes and performance of organizations because its focal point is on research and reflections relevant to academicians, research scholar and practicing managers.
NEED FOR THE STUDY
The Periodicals are the indicators of literature growth in any field of the knowledge. They emerge as the main channel for transmitting knowledge. Because of the escalating cost of the periodicals and lack of decent library budgets, the selection of any journal for a library should be done properly. Now a day the Library authorities are forced to reduce the number of journal subscriptions. Bibliometric analysis has relevance in library and information science in determine research trends, core journals, etc., and so that framing subscription policies for tomorrow. This study will be helpful for librarians for the collection development for their library.
OBJECTIVES OF THE STUDY
The objective of the present study has been analyzing the objectives aspects.
- To analysis of articles published from 2010-2014 only for the “Indian Journal of Marketing”
- To identify the number of contributions in published articles.
- To determine the year-wise distribution of articles in that particular journal only.
- To study the authorship pattern
- To study the subject coverage of articles in that journal.
- To study the length of articles of particular journal.
METHODOLOGY
The methodology applied in the present study is bibliometric analysis that is used to study in detail the bibliographic features of the particular journal articles and citation analysis of the references at the end of each article published in “Indian Journal of Marketing” from 2010-2014. For this the relevant data are collected and recorded in separate file. Then they are tabulated and analysed for making observations for the bibliometric research study.
DATA ANALYSIS
The analysis was done in two parts
- Article Analysis
- Number of Articles:
- Subject Distribution of Articles:
- Authorship Pattern:
- Year-wise Authorship Pattern:
- Institution-wise Contribution:
- Length of Articles:
- Citation Analysis:
- Referencing Characteristics:
- Forms of Documents Cited:
1) Analysis of articles and 2) Analysis of citations.
All the details such as author(s), title, year of publication and pagination etc., of all articles published from 2010 to 2014 were recorded for the following analysis.
A total number of 390 articles published during the period 2010-2014 and has been recorded for the present study.
Year |
Vol. |
No. of Issues |
No. of Articles |
%age |
2010 |
40 |
12 |
91 |
23.34 |
2011 |
41 |
12 |
93 |
23.85 |
2012 |
42 |
12 |
81 |
20.76 |
2013 |
43 |
12 |
70 |
17.94 |
2014 |
44 |
12 |
55 |
14.11 |
Total |
60 |
390 |
100.00 |
|
The table-1 shows the maximum number of articles published in 2011 (93) and minimum in 2014 (55) articles. The journal publishes on an average of 78 articles per year.
Subject |
No.of Articles |
%age |
Consumer Behavior |
140 |
35.90 |
Branding |
105 |
26.92 |
Online Marketing |
45 |
11.53 |
Retailing |
30 |
7.70 |
Rural Marketing |
25 |
6.41 |
Marketing Strategies |
20 |
5.12 |
Others |
25 |
6.42 |
Total |
390 |
100.00 |
Table-2 Subject Distribution of Articles
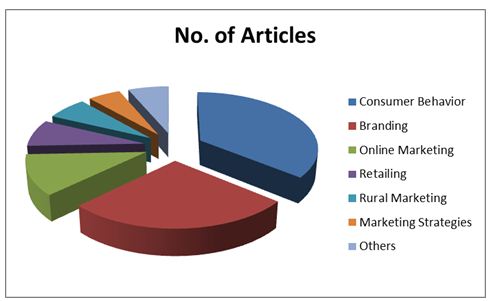
Chart- 1
Table 2 and chart-1 above shows that a majority of a contributions appeared under Consumer Behavior 140 (35.90%) and on branding shows 105 (26.92%). After that position is taken by Online marketing 45 (11.53%), Retailing 30 (7.70%), Rural Marketing 25 (6.41%), Marketing Strategies 20 (5.12%), Other subjects of marketing 25 (6.42%).
Year |
No. of Authors |
Total |
|||
1 |
2 |
3 |
4 |
||
2010 |
40 |
42 |
7 |
|
89 |
2011 |
45 |
39 |
5 |
1 |
90 |
2012 |
39 |
35 |
7 |
|
81 |
2013 |
25 |
41 |
7 |
1 |
74 |
2014 |
11 |
29 |
12 |
3 |
55 |
Total |
160 |
186 |
38 |
5 |
389 |
%age |
41.14 |
47.82 |
9.76 |
1.28 |
100 |
Table-3 Authorship pattern
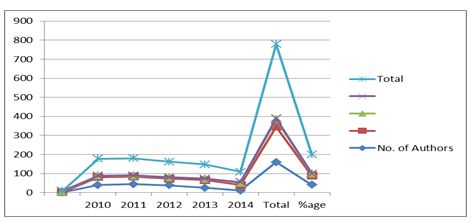
Chart- 2
Table 3 and Chart-2 reveals the authorship pattern of the articles published during the period of this study. The largest number of articles had two authors 186 (47.82%). This is followed by single author 160 (41.14%), three authors 38 (9.76%) and four authors with 5 (1.28%) of the total articles.
Authorship |
Year |
Total |
%age | ||||
2010 |
2011 |
2012 |
2013 |
2014 |
|||
Single |
40 |
45 |
39 | 25 | 11 |
160 | 41.13 |
Joint |
49 |
46 |
40 | 49 | 45 |
229 | 58.87 |
Total |
89 |
91 |
79 | 74 | 56 |
389 | 100.00 |
Table-4 Year-wise Authorship pattern
The above table-4 shows that out of 390 articles single authors contributed 160 (41.13%) while the rest 229 (58.57%) articles were contributed by joint authors.
Name of Institute |
No. of Articles |
%age |
Universities |
93 |
33.34 |
Colleges |
63 |
22.58 |
Business School |
84 |
30.11s |
Research Institute |
27 |
9.67 |
Companies |
12 |
4.30 |
Total |
279 |
100.00 |
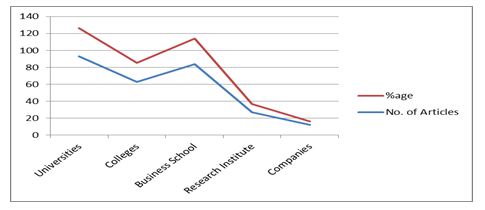
Chart- 3
A majority of the articles 93 (33.34%) were contributed by Universities. This is followed by Business school with 84 (30.11%) and colleges 63 (22.58%) articles and research institute 27 (9.67%). The remaining 12 (4.30%) articles were contributed by Companies.
Authorship |
Year |
Total |
%age |
||||
2010 |
2011 |
2012 |
2013 |
2014 |
|||
5-10 |
18 |
25 |
23 |
30 |
28 |
124 |
31.79 |
11-15 |
25 |
30 |
26 |
32 |
28 |
141 |
36.15 |
16-20 |
20 |
35 |
29 |
21 |
20 |
125 |
32.06 |
Total |
63 |
80 |
78 |
83 |
76 |
390 |
100.00 |
Above table shows that the majority articles 141 (36.15%) have the length of 11-15 pages followed by 125 (32.06%) articles with the 16-20 pages and remaining 124 (31.79%) articles with (5-10) page.
In the citation analysis the references provided by the authors at the end of their article and it are basis of citation analysis method. The Citation traces a connection between two documents, in that the one which cites and another which is cited. The Citation analysis is one of the popular methods for the citation and it is applied to derive the following aspects:
Articles with and without references are accounted as follows:
Category |
No. of Articles |
%age |
Without reference |
390 |
100.00 |
Total |
390 |
100.00 |
All the articles have references 390 (100.00 %).
Distribution of various forms of cited documents are given in the following table. They include journals, books, reference books, dissertations, conference proceedings, seminars etc.
Forms of Documents |
Total No. of Citations |
%age |
Journals |
275 |
40.44 |
Books |
80 |
11.76 |
Proceedings |
180 |
26.47 |
Websites |
145 |
21.33 |
Total |
680 |
100.00 |
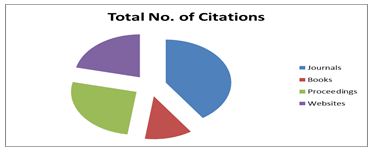
Chart- 4
A maximum authors are preferred journals as the source of information for their research articles and that all are occupied the top position with the highest number of citations 275 (40.44%) of the total 680 citations followed that position is occupied by proceedings with 180 (26.47%) citations, 145 (21.33%) articles shows websites as a references and least 80 (1.76%) articles shows books citations.
Findings:
From the above research here author find some findings and which are as below:
- Here find that the researchers are now a day not writes much more article. The researchers are interested to upload their articles on internet as an open source.
- In this “Indian Journal of Marketing” maximum articles are shows in the Consumer Behavior subjects.
- From this study here find that the sharing base or joint author articles are very high compare to others.
- In the Institute-wise contributors the universities are maximum.
- In the length of articles the maximum articles are shows more than 11-15 pages.
- Mostly all the articles are shows high references.
- Maximum authors are used journals for the research articles and their research work also.
Conclusion
The journal “Indian Journal of Marketing” has a very long history of 47 years, from that this study examined for five (2010-2014). In this period the journal has tried to keep up its main aim of acting as communication of all users of management, marketing and research scholars and commerce students and faculties to update their subjective knowledge. This research study reveals that the highest articles have appeared in the area of consumer study and consumer behavior.
The bibliometric techniques are being used for a variety of purposes like determination of various indicators and evaluation of output for a research documents. The journal has published 390 articles during the period of this research study. The maximum numbers of contributions are joint authors. The study revealed that the highest contributions were from universities. Majority of the authors preferred journals as the source of information for the highest number of citations.
References:
***************************************************
Dr. Jagdishchandra P. Gondalia
Librarian
Shree Mahila Art & Commerce College, Junagadh
Indira Dodiya
Asst. Librarian
K.S.School of Business Management,
Gujarat University, Ahmedabad


Home | Archive | Advisory Committee | Contact us