Indian Youth & Reality Shows
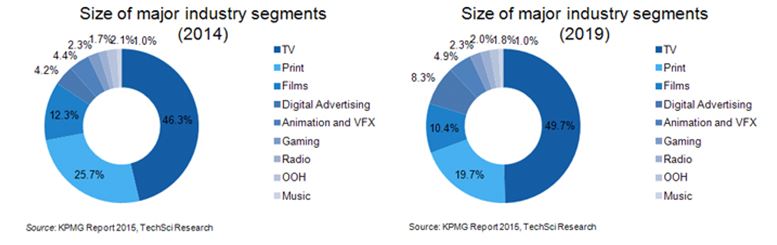
Abstract : Media & Entertainment Industry is growing day by day and there is a lot more competition between the channels to increase their TRP. Indian Youth is currently the strength of India. Also Indian Youth is now becoming more techno savvy. To understand their viewing pattern and the perception towards the TV shows & their media habits are being crucial for the Industry. As there is lot more increase in the reality shows on the Channels, The study focuses on identifying the perception of the Indian Youth (Viewers’) toward the reality show. It gives major variables to keep in mind for designing the reality show for Indian Youth. For the results Descriptive Statistics, ANOVA and Multiple comparisons Post Hoc LSD test have been performed. The study found major attributes and choice of the reality show preferred by Indian Youth. The Indian Media & Entertainment Industry is growing as fast as new technology developments like Digital HD, 3G/4G technology etc arriving. “The Indian media and entertainment industry is projected to grow at close to 13% in 2015 over the previous year with television growing at a robust 14.46%, print at 8% and digital at 44%, taking forward the growth of these sectors in 2014.”(Source: Ficci-KPMG Indian Media and Entertainment Industry Report, 2015). Entertainment channels on the television have started the trend of Introducing the reality shows like “Koun Banega Karodpati”, “Comedy night with Kapil”, “Satyamev Jayate”, “Sa Re Ga Ma Pa”, “Dance India Dance”, “Master Chef India”, “Coffee with Karan”, “Dance Plus” etc. The Trend of “Saas Bahu drama” television channels moving with Reality Shows in which they use Celebrity, Concept, Anchors, Participants etc.. Reality Show also becomes one of the major sources of promotion for the Movies. Indian Youth is currently the big asset of India. It includes the people of 15-29 years of the age (source: National Youth Policy 2014). To understand their perception towards Reality shows helps the TV channel to design the show specifically targeting the youth of India. Many Researchers have worked on the reality show. “One of the survey in reality TV viewers revealed that the most salient motives for watching reality TV were habitual pass time and reality entertainment. Additional analysis indicated that those who enjoyed reality TV, the most for its entertainment and relaxing value also tended to perceive the meticulously edited and frequently preplanned content of reality interaction as realistic (Zizi Papacharissi & Andrew L. Mendelson 2011).” Despite the general presence of reality-based television programming for more than a decade and its recent increasing popularity, the extant literature on the phenomenon is limited (Robin L. Nabi, Erica N. Biely, Sara J. Morgan & Carmen R. Stitt 2009). “Research conducted by the Nabi, Morgan & Sitt 2009 suggested through their studies that (a) the role of voyeurism in the appeal of reality-based television is questionable, (b) regular viewers receive different and more varied gratifications from their viewing than do periodic viewers, and (c) impulsivity seeking and need for cognition do not predict overall reality-based TV viewing”. “Curiosity about others appears to be a key distinguishing gratification between reality and fictional programming; it is not always a predictor of reality television enjoyment. Indeed, many predictors of enjoyment, like happiness, social comparison, self-awareness, negative outcome, and dramatic challenge, varied as much among types of reality programs as between reality and fiction (Robin L. Nabi, Carmen R. Stitt, Jeff Halford & Keli L. Finnerty 2009)”. “The role of social affiliation in the students' consumption of reality Shows, the results of focus groups indicate that while participants perceive a social stigma associated with watching reality television, they continue to watch because of the perceived escapism and social affiliation provided (Lisa K. Lundy, Amanda M. Ruth & Travis D. Park 2008).”
Rational of the study: the research will help the organizers’ to understand the perception and preferences of the Indian youth towards the reality shows also It will help them to identify major influencing factors by which they can increase their TRP.
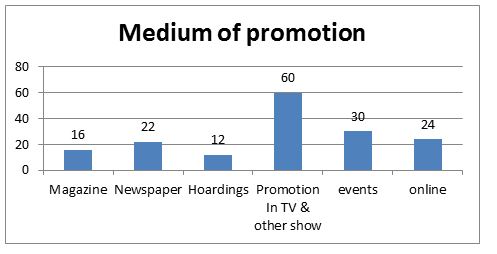
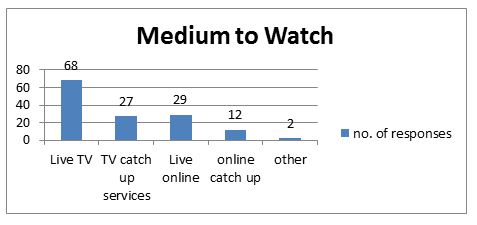
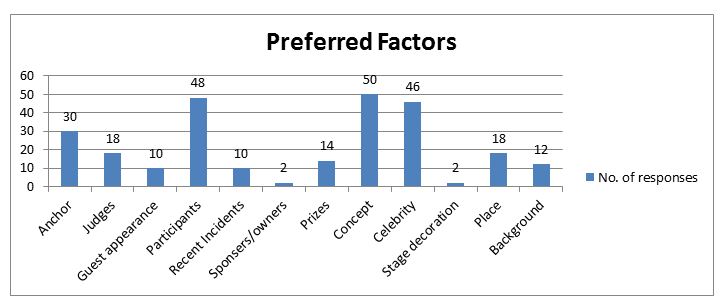
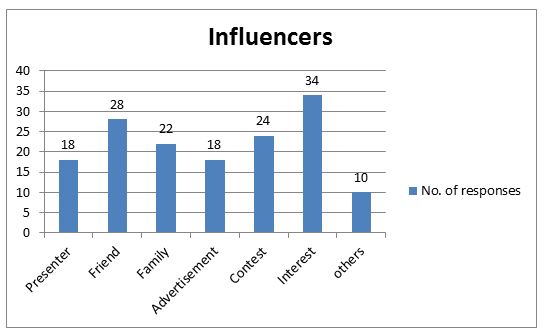
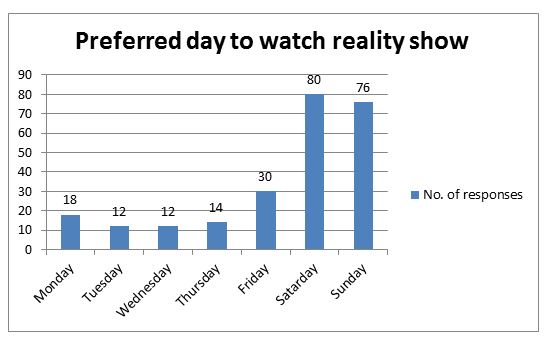
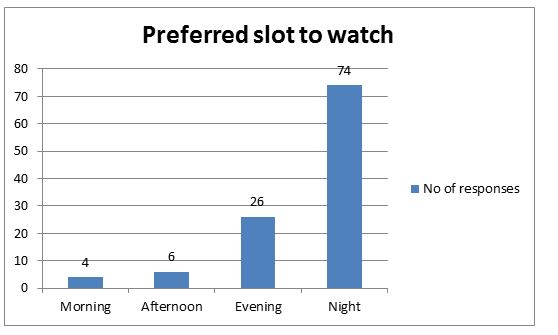
For the study research papers in foreign context and in Indian context have been used. I have also referred some of the websites & blogs which are part of my secondary survey and further primary survey with structured questionnaire have been conducted. As this study is for the Indian youth, target population is the age group between 15 to 29 years. Research Design: Descriptive study (As my area of research is about finding the perception and influencing factors, descriptive study is the most relevant) and the sampling design is Non-Probability -Convenience sampling. Sample size for the study is 110 & all the samples are received from the age group between 15 to 25 years and all are the students. Data Analysis: Figure 1: Preference to watch Reality show Figure 2 Shows 60 responses preferred promotion in TV & other shows, while 30 through events, 24 online and then follows Newspaper (22) , Magazine (16) & Hoardings (12) Figure 2: Preferred Medium of Promotion Figure 3 shows the most preferred medium/source to watch reality show is Live TV (68 responses). Figure: 3 Preferred Medium/source to watch reality show Figure 4: Preferred factors to watch reality show Figure 4 shows preferred factors in the reality shows by Youth of our sample are concept (50 responses), then participants (48 responses), then celebrity (46), Anchor (30) and follows by others. Figure 5 shows our youth influence maximum to watch reality show by their own interest (34 responses), then friends (28), then follows contest (24), family (22) etc. Figure 5: Influencers (to make our youth watch reality shows) Figure 6: Preferred day to watch reality show Figure 7: Preferred slot to watch reality show Preference of the viewers’ (youth) about the TV shows: To achieve the above objective ANOVA, Descriptive Statistics & Post Hoc LSD Test has been performed by using SPSS version 20. H0: There is no significant difference in the preferences of TV programs among the respondents. Ha: There is significant difference in the preferences of TV programs among the respondents. Figure 8: Descriptive Statistics Figure 9: ANOVA Table Figure 9 shows Significance value for the ANOVA is 0.000 which is less than 0.05 so null hypothesis rejected. So there is significant difference in the preferences for the TV shows among the viewers’ (respondents). Also to identify which pair have significant difference Post Hoc LSD test has been performed in See Annexure 1. There is no significance difference between the Discovery & Music show (sig value 0.760 greater than 0.05 so not reject null), Discovery & News (sig value 0.610), but there is sig difference between Discovery & Tourism (sig value 0.047 which is less than 0.05 so null rejected). So from Figure 8 and Annexure 1 shows highly preferred TV show by respondents (our youth) are Discovery, music & news then Second preference of the youth Tourism, History & Reality show then the others are preferred. Major objective of Preference for the Reality Show: Ho: There is no significant difference in the preferences of reality shows among the respondents. Ha: There is significant difference in the preferences of reality shows among the respondents. In Figure 11 ANOVA Table significance value is 0.000 which is less than 0.05, so the null hypothesis is rejected. There is significant difference in the preferences of reality shows among the youth. In Annexure 2 the Pos Hoc Test (LSD) test For Comedy highest rating is given. For Comedy and quiz the significance value is 0.055 which is greater than 0.05, means there is no significance difference in the Comedy and quiz show preferred by the respondents. So viewer’s first preference is Comedy & Quiz show. Then Comedy & talk show sig value is 0.000 & also for the Quiz and talk show sig value 0.033 so reject the null hypothesis. So next preference is talk show then singing and at last crime. To all respondents one open ended question related to their choice of the show had been asked and the results matching the above finding as most respondents liked “Comedy night with Kapil” and “Kaun banega Karodpati”. Figure 10 Descriptive Statistics for the reality shows Figure 11: ANOVA for Reality show Major Findings: Conclusion: Limitation & future scope of the study:
Research Methodology:
(Source: www. youthpolicy.org/factsheets/country/india/)
To identify the preferred TV show & reality show 5-Point Likert Scale (1=not at all preferred, 5=Highly Preferred) have been used.
There are 61 (55%) Male and 49 (45%) Female respondents (total 110). All respondents are from the 15-25 years of the Age group and all are the student. Figure 1 shows 51% of the respondents preferred to watch reality show every day.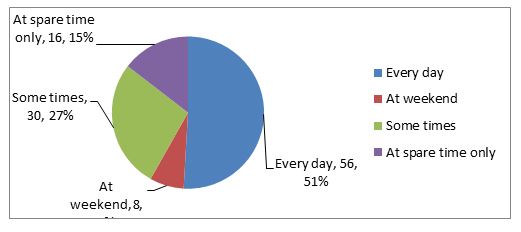
N Mean Std. Deviation Std. Error 95% Confidence Interval for Mean Minimum Maximum
Lower Bound Upper Bound
reality show 110 3.1273 1.34170 .12793 2.8737 3.3808 1.00 5.00
tv serial 110 2.6727 1.48453 .14154 2.3922 2.9533 1.00 5.00
discovery 110 3.5818 1.19157 .11361 3.3566 3.8070 1.00 5.00
cartoon network 110 3.0727 1.31127 .12502 2.8249 3.3205 1.00 5.00
History 110 3.1818 1.25750 .11990 2.9442 3.4195 1.00 5.00
Tourism 110 3.2273 1.33862 .12763 2.9743 3.4802 1.00 5.00
cooking show 110 2.8545 1.34667 .12840 2.6001 3.1090 1.00 5.00
News 110 3.4909 1.21720 .11606 3.2609 3.7209 1.00 5.00
music 110 3.5273 1.23191 .11746 3.2945 3.7601 1.00 5.00
devotional channel 110 2.3909 1.46579 .13976 2.1139 2.6679 1.00 5.00
Total 1100 3.1127 1.36644 .04120 3.0319 3.1936 1.00 5.00
Sum of Squares df Mean Square F Sig.
Between Groups 146.949 9 16.328 9.342 .000
Within Groups 1905.073 1090 1.748
Total 2052.022 1099
N Mean Std. Deviation Std. Error 95% Confidence Interval for Mean Minimum Maximum
Lower Bound Upper Bound
dance program 110 3.4000 1.38272 .13184 3.1387 3.6613 1.00 5.00
singing 110 3.4364 1.25272 .11944 3.1996 3.6731 1.00 5.00
crime 110 3.1727 1.24782 .11897 2.9369 3.4085 1.00 5.00
game show 110 3.2364 1.50794 .14378 2.9514 3.5213 1.00 5.00
comedy 110 4.0909 1.16166 .11076 3.8714 4.3104 1.00 5.00
quiz 110 3.7545 1.24286 .11850 3.5197 3.9894 1.00 5.00
talk show 110 3.4818 1.25604 .11976 3.1445 3.6192 1.00 5.00
Total 770 3.4961 1.32618 .04779 3.4023 3.5899 1.00 5.00
Sum of Squares df Mean Square F Sig.
Between Groups 68.034 6 11.339 6.736 .000
Within Groups 1284.455 763 1.683
Total 1352.488 769
Annexure
Multiple comparison Test (Post Hoc LSD Test for preference of TV shows/program):
(I) Tv_Programs |
(J) Tv_Programs |
Mean Difference (I-J) |
Std. Error |
Sig. |
95% Confidence Interval |
|
|
|
|
|
Lower Bound |
Upper Bound |
|
Reality Show |
Tv Serial |
.45455* |
.17826 |
.011 |
.1048 |
.8043 |
Discovery |
-.45455* |
.17826 |
.011 |
-.8043 |
-.1048 |
|
Cartoon Network |
.05455 |
.17826 |
.760 |
-.2952 |
.4043 |
|
History |
-.05455 |
.17826 |
.760 |
-.4043 |
.2952 |
|
Tourism |
-.10000 |
.17826 |
.575 |
-.4498 |
.2498 |
|
Cooking Show |
.27273 |
.17826 |
.126 |
-.0771 |
.6225 |
|
News |
-.36364* |
.17826 |
.042 |
-.7134 |
-.0139 |
|
Music |
-.40000* |
.17826 |
.025 |
-.7498 |
-.0502 |
|
Devotional Channel |
.73636* |
.17826 |
.000 |
.3866 |
1.0861 |
|
Tv Serial |
Reality Show |
-.45455* |
.17826 |
.011 |
-.8043 |
-.1048 |
Discovery |
-.90909* |
.17826 |
.000 |
-1.2589 |
-.5593 |
|
Cartoon Network |
-.40000* |
.17826 |
.025 |
-.7498 |
-.0502 |
|
History |
-.50909* |
.17826 |
.004 |
-.8589 |
-.1593 |
|
Tourism |
-.55455* |
.17826 |
.002 |
-.9043 |
-.2048 |
|
Cooking Show |
-.18182 |
.17826 |
.308 |
-.5316 |
.1680 |
|
News |
-.81818* |
.17826 |
.000 |
-1.1680 |
-.4684 |
|
Music |
-.85455* |
.17826 |
.000 |
-1.2043 |
-.5048 |
|
Devotional Channel |
.28182 |
.17826 |
.114 |
-.0680 |
.6316 |
|
Discovery |
Reality Show |
.45455* |
.17826 |
.011 |
.1048 |
.8043 |
Tv Serial |
.90909* |
.17826 |
.000 |
.5593 |
1.2589 |
|
Cartoon Network |
.50909* |
.17826 |
.004 |
.1593 |
.8589 |
|
History |
.40000* |
.17826 |
.025 |
.0502 |
.7498 |
|
Tourism |
.35455* |
.17826 |
.047 |
.0048 |
.7043 |
|
Cooking Show |
.72727* |
.17826 |
.000 |
.3775 |
1.0771 |
|
News |
.09091 |
.17826 |
.610 |
-.2589 |
.4407 |
|
Music |
.05455 |
.17826 |
.760 |
-.2952 |
.4043 |
|
Devotional Channel |
1.19091* |
.17826 |
.000 |
.8411 |
1.5407 |
|
Cartoon Network |
Reality Show |
-.05455 |
.17826 |
.760 |
-.4043 |
.2952 |
Tv Serial |
.40000* |
.17826 |
.025 |
.0502 |
.7498 |
|
Discovery |
-.50909* |
.17826 |
.004 |
-.8589 |
-.1593 |
|
History |
-.10909 |
.17826 |
.541 |
-.4589 |
.2407 |
|
Tourism |
-.15455 |
.17826 |
.386 |
-.5043 |
.1952 |
|
Cooking Show |
.21818 |
.17826 |
.221 |
-.1316 |
.5680 |
|
News |
-.41818* |
.17826 |
.019 |
-.7680 |
-.0684 |
|
Music |
-.45455* |
.17826 |
.011 |
-.8043 |
-.1048 |
|
Devotional Channel |
.68182* |
.17826 |
.000 |
.3320 |
1.0316 |
|
History |
Reality Show |
.05455 |
.17826 |
.760 |
-.2952 |
.4043 |
Tv Serial |
.50909* |
.17826 |
.004 |
.1593 |
.8589 |
|
Discovery |
-.40000* |
.17826 |
.025 |
-.7498 |
-.0502 |
|
Cartoon Network |
.10909 |
.17826 |
.541 |
-.2407 |
.4589 |
|
Tourism |
-.04545 |
.17826 |
.799 |
-.3952 |
.3043 |
|
Cooking Show |
.32727 |
.17826 |
.067 |
-.0225 |
.6771 |
|
News |
-.30909 |
.17826 |
.083 |
-.6589 |
.0407 |
|
Music Channel |
-.34545 |
.17826 |
.053 |
-.6952 |
.0043 |
|
Devotional Channel |
.79091* |
.17826 |
.000 |
.4411 |
1.1407 |
|
Tourism |
Reality Show |
.10000 |
.17826 |
.575 |
-.2498 |
.4498 |
Tv Serial |
.55455* |
.17826 |
.002 |
.2048 |
.9043 |
|
Discovery |
-.35455* |
.17826 |
.047 |
-.7043 |
-.0048 |
|
Cartoon Network |
.15455 |
.17826 |
.386 |
-.1952 |
.5043 |
|
History |
.04545 |
.17826 |
.799 |
-.3043 |
.3952 |
|
Cooking Show |
.37273* |
.17826 |
.037 |
.0229 |
.7225 |
|
News |
-.26364 |
.17826 |
.139 |
-.6134 |
.0861 |
|
Music |
-.30000 |
.17826 |
.093 |
-.6498 |
.0498 |
|
Devotional Channel |
.83636* |
.17826 |
.000 |
.4866 |
1.1861 |
|
Cooking Show |
Reality Show |
-.27273 |
.17826 |
.126 |
-.6225 |
.0771 |
Tv Serial |
.18182 |
.17826 |
.308 |
-.1680 |
.5316 |
|
Discovery |
-.72727* |
.17826 |
.000 |
-1.0771 |
-.3775 |
|
Cartoon Network |
-.21818 |
.17826 |
.221 |
-.5680 |
.1316 |
|
History |
-.32727 |
.17826 |
.067 |
-.6771 |
.0225 |
|
Tourism |
-.37273* |
.17826 |
.037 |
-.7225 |
-.0229 |
|
News |
-.63636* |
.17826 |
.000 |
-.9861 |
-.2866 |
|
Music Channel |
-.67273* |
.17826 |
.000 |
-1.0225 |
-.3229 |
|
Devotional Channel |
.46364* |
.17826 |
.009 |
.1139 |
.8134 |
|
News |
Reality Show |
.36364* |
.17826 |
.042 |
.0139 |
.7134 |
Tv Serial |
.81818* |
.17826 |
.000 |
.4684 |
1.1680 |
|
Discovery |
-.09091 |
.17826 |
.610 |
-.4407 |
.2589 |
|
Cartoon Network |
.41818* |
.17826 |
.019 |
.0684 |
.7680 |
|
History |
.30909 |
.17826 |
.083 |
-.0407 |
.6589 |
|
Tourism |
.26364 |
.17826 |
.139 |
-.0861 |
.6134 |
|
Cooking Show |
.63636* |
.17826 |
.000 |
.2866 |
.9861 |
|
Music |
-.03636 |
.17826 |
.838 |
-.3861 |
.3134 |
|
Devotional Channel |
1.10000* |
.17826 |
.000 |
.7502 |
1.4498 |
|
Music |
Reality Show |
.40000* |
.17826 |
.025 |
.0502 |
.7498 |
Tv Serial |
.85455* |
.17826 |
.000 |
.5048 |
1.2043 |
|
Discovery |
-.05455 |
.17826 |
.760 |
-.4043 |
.2952 |
|
Cartoon Network |
.45455* |
.17826 |
.011 |
.1048 |
.8043 |
|
History |
.34545 |
.17826 |
.053 |
-.0043 |
.6952 |
|
Tourism |
.30000 |
.17826 |
.093 |
-.0498 |
.6498 |
|
Cooking Show |
.67273* |
.17826 |
.000 |
.3229 |
1.0225 |
|
News |
.03636 |
.17826 |
.838 |
-.3134 |
.3861 |
|
Devotional Channel |
1.13636* |
.17826 |
.000 |
.7866 |
1.4861 |
|
Devotional Channel |
Reality Show |
-.73636* |
.17826 |
.000 |
-1.0861 |
-.3866 |
Tv Serial |
-.28182 |
.17826 |
.114 |
-.6316 |
.0680 |
|
Discovery |
-1.19091* |
.17826 |
.000 |
-1.5407 |
-.8411 |
|
Cartoon Network |
-.68182* |
.17826 |
.000 |
-1.0316 |
-.3320 |
|
History |
-.79091* |
.17826 |
.000 |
-1.1407 |
-.4411 |
|
Tourism |
-.83636* |
.17826 |
.000 |
-1.1861 |
-.4866 |
|
Cooking Show |
-.46364* |
.17826 |
.009 |
-.8134 |
-.1139 |
|
News |
-1.10000* |
.17826 |
.000 |
-1.4498 |
-.7502 |
|
Music |
-1.13636* |
.17826 |
.000 |
-1.4861 |
-.7866 |
|
Multiple comparison Test (Post Hoc LSD Test for preference of Reality Show):
(I) Reality_Shows |
(J) Reality_Shows |
Mean Difference (I-J) |
Std. Error |
Sig. |
95% Confidence Interval |
|
Lower Bound |
Upper Bound |
|||||
Dance Program |
Singing |
-.03636 |
.17495 |
.835 |
-.3798 |
.3071 |
Crime |
.22727 |
.17495 |
.194 |
-.1162 |
.5707 |
|
Game Show |
.16364 |
.17495 |
.350 |
-.1798 |
.5071 |
|
Comedy |
-.69091* |
.17495 |
.000 |
-1.0344 |
-.3475 |
|
Quiz |
-.35455* |
.17495 |
.043 |
-.6980 |
-.0111 |
|
Talk Show |
.01818 |
.17495 |
.917 |
-.3253 |
.3616 |
|
Singing |
Dance Program |
.03636 |
.17495 |
.835 |
-.3071 |
.3798 |
Crime |
.26364 |
.17495 |
.132 |
-.0798 |
.6071 |
|
Game Show |
.20000 |
.17495 |
.253 |
-.1434 |
.5434 |
|
Comedy |
-.65455* |
.17495 |
.000 |
-.9980 |
-.3111 |
|
Quiz |
-.31818 |
.17495 |
.069 |
-.6616 |
.0253 |
|
Talk Show |
.05455 |
.17495 |
.755 |
-.2889 |
.3980 |
|
Crime |
Dance Program |
-.22727 |
.17495 |
.194 |
-.5707 |
.1162 |
Singing |
-.26364 |
.17495 |
.132 |
-.6071 |
.0798 |
|
Game Show |
-.06364 |
.17495 |
.716 |
-.4071 |
.2798 |
|
Comedy |
-.91818* |
.17495 |
.000 |
-1.2616 |
-.5747 |
|
Quiz |
-.58182* |
.17495 |
.001 |
-.9253 |
-.2384 |
|
Talk Show |
-.20909 |
.17495 |
.232 |
-.5525 |
.1344 |
|
Game Show |
Dance Program |
-.16364 |
.17495 |
.350 |
-.5071 |
.1798 |
Singing |
-.20000 |
.17495 |
.253 |
-.5434 |
.1434 |
|
Crime |
.06364 |
.17495 |
.716 |
-.2798 |
.4071 |
|
Comedy |
-.85455* |
.17495 |
.000 |
-1.1980 |
-.5111 |
|
Quiz |
-.51818* |
.17495 |
.003 |
-.8616 |
-.1747 |
|
Talk Show |
-.14545 |
.17495 |
.406 |
-.4889 |
.1980 |
|
Comedy |
Dance Program |
.69091* |
.17495 |
.000 |
.3475 |
1.0344 |
Singing |
.65455* |
.17495 |
.000 |
.3111 |
.9980 |
|
Crime |
.91818* |
.17495 |
.000 |
.5747 |
1.2616 |
|
Game Show |
.85455* |
.17495 |
.000 |
.5111 |
1.1980 |
|
Quiz |
.33636 |
.17495 |
.055 |
-.0071 |
.6798 |
|
Talk Show |
.70909* |
.17495 |
.000 |
.3656 |
1.0525 |
|
Quiz |
Dance Program |
.35455* |
.17495 |
.043 |
.0111 |
.6980 |
Singing |
.31818 |
.17495 |
.069 |
-.0253 |
.6616 |
|
Crime |
.58182* |
.17495 |
.001 |
.2384 |
.9253 |
|
Game Show |
.51818* |
.17495 |
.003 |
.1747 |
.8616 |
|
Comedy |
-.33636 |
.17495 |
.055 |
-.6798 |
.0071 |
|
Talk Show |
.37273* |
.17495 |
.033 |
.0293 |
.7162 |
|
Talk Show |
Dance Program |
-.01818 |
.17495 |
.917 |
-.3616 |
.3253 |
Singing |
-.05455 |
.17495 |
.755 |
-.3980 |
.2889 |
|
Crime |
.20909 |
.17495 |
.232 |
-.1344 |
.5525 |
|
Game Show |
.14545 |
.17495 |
.406 |
-.1980 |
.4889 |
|
Comedy |
-.70909* |
.17495 |
.000 |
-1.0525 |
-.3656 |
|
Quiz |
-.37273* |
.17495 |
.033 |
-.7162 |
-.0293 |
|
*. The Mean Difference Is Significant At The 0.05 Level. |
||||||
References :
***************************************************
Ms. Mansi R. Rathod
Assistant Professor,
Centre for Management Studies,
Dharmsinh Desai University,
Nadiad, Gujarat


Home | Archive | Advisory Committee | Contact us