Characteristics of Aerosol Columnar Size Distributions over Rajkot
Abstract
Extensive measurements of spectral aerosol optical depths (AODs) were made at Rajkot, Gujarat using two hand-held, microprocessor-based sun photometers [MICROTOPS-II (version 2.43 & 5.5)] from March 2005 to February 2008 (a total of 367 days of clear-sky observations). Using these spectral AOD values, the columnar size distribution (CSD) function of aerosols have been derived. During summer the CSD, retrieved from spectral AODs are bimodal (combination of power law and unimodal log normal distribution) with a prominent secondary (or coarse) mode occurring at a fairly large value of radius (r > 0.5 μm), while the primary (or fine) mode either does not appear explicitly or perhaps occurs below the radius ≅ 0.1 μm. The bimodal nature of CSDs indicates the presence of fine as well as coarse mode aerosols over the observational site during summer. The effective radius computed from deduced CSD shows minimum values during winter (November to February) having power law type and maximum during summer (March to June) months.
Keywords: Extinction coefficients; Optical depth; Size distribution
Introduction
Size distribution is one of the most prominent properties of atmospheric aerosols from the stand point of climate impact. Most of the effects of aerosols can be understood only with the knowledge of its size distribution. Many processes in the Earth’s atmosphere concerning these aerosols are closely related to the aerosol size distribution therefore it is quite essential to understand the size distribution of aerosols as far as their effect on both climate and human health are concerned. The effect of aerosols on climate is generally classified into direct and indirect effect. The direct effect comes from the capability of aerosols to scatter and absorb the incoming short wave and outgoing long wave solar radiation (Charlson et al., 1992), while the indirect effect is a result of the ability of aerosols to act as cloud condensation nuclei; thereby affecting the cloud droplet size distribution, droplet concentration, optical properties, precipitation rate and lifetime of clouds (Rosenfield, 2000). Furthermore, the aerosol size distributions along with particle refractive index and shape are one of the most important parameters, which determine their optical properties such as optical thickness, asymmetry factor, scattering phase function, single scattering albedo and other useful information needed in the aerosol radiative forcing estimation.
The studies on the optical properties of aerosols over Rajkot (Ritweej et. al. 2007) has indicated seasonal change in the spectral dependence of AOD associated with change in wind speed and wind direction suggesting possible role of the particle size spectrum. This aspect has been investigated in detail by the authors by retrieving the columnar size distributions from the spectral values of AOD. This paper describes the characteristics of aerosol size distributions retrieved from spectral optical depths measured at Rajkot during three year period from March 2005 to February 2008. The experimental details and results are presented in the following sections and discussed.
Experimental & Characterization Details
Measurements of spectral aerosol optical depths (AODs) which characterize the integrated extinction of solar radiation suffered during its transit through the earth atmosphere were made by using a multi wavelength MICROTOPS II sunphotometer. The details of the instrument, method of data analysis and error budget are discussed in earlier paper (Ritweej et. al., 2007). Estimates of columnar AODs were made regularly on all clear sky day conditions during three-year period (2005 to 2008) at Rajkot. These are averaged to get the monthly mean AOD spectra. A total 30 AOD spectra (there is no representative data of July and August months of every year due to worse sky condition), thus generated during the above period, formed the basic data set in the present study.
The experimental data considered of spectral AOD, carry information about the aerosol size distribution. Using these spectral AOD values, the CSD function of aerosols have been determined by numerical inversion of the Mie integral equation,
where Qext is the aerosol Mie extinction efficiency parameter, which is a function of the aerosol complex refractive index (m), radius (r) and wavelength of the incident radiation (λ); nc(r) is the columnar number density of aerosols (in a vertical column of unit cross section in an infinitesimal radius range dr centered at r). In defining the nc(r) this way, it is implicitly assumed that the number size distribution is height invariant or averaged over the vertical column. The radii limits r1 and r2 to the integral are respectively the lower and upper cutoff radii of the particles, such that only those particles having sizes within the range r1 to r2 contribute significantly to Qext. Since the MICROTOPS II measures only the directly transmitted flux, we used the spectral AODs and Eq. (1) to retrieve the columnar size distribution. The spectral AODs from the measurements and the corresponding errors formed the inputs. Eq. (1) is solved for nc(r), following the iterative inversion procedure described by King (1982), as applied by Moorthy et al. (1997). This technique provides fairly accurate information about the aerosol size distributions if the Lagrange multiplier, refractive index, and radius range are carefully selected (King, 1982), particularly when the τpλ spectra do not show large oscillations. The wavelength dependent complex refractive index of aerosols depends on the aerosol chemical composition and as such it is different for different types of aerosols. As the chemical composition was not available to us due to lack of facility, the values of refractive index as a function of wavelengths are taken from the literature for different types of aerosols (Shettle and Fenn, 1979), for estimating the Qext values in Eq. (1). The spectral AODs are re-estimated using the direct Mie equation, after each iteration, and are compared with the input AOD spectrum, and the solution are accepted only when the re-estimated AOD values agree with those from measurements within the measurement errors. As the measurement errors are used as input, the solutions are weighted by these errors with better accuracy around the size ranges sensitive to more accurate AOD measurements (King, 1982).
Results
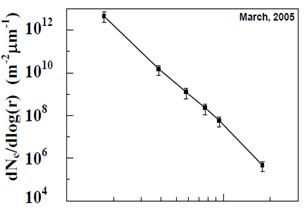
The size distribution results are presented here in terms of dNc/dlog(r), which represent the number of particles per unit area per unit log radius interval in a vertical column through the atmosphere. Figure 1 and Figure 2 show the typical columnar size distributions retrieved for different months for the entire data period of March, 2005 to February, 2008 (only the representative graphs have been shown here). During July and August of every year, MICROTOPS data could not be collected because of the adverse sky conditions. The retrieved 30 monthly representative CSDs are classified into two types namely, power-law type (Figure 1), and bimodal (mixture of power-law type and lognormal type, Figure 2).
Radius
Figure 1: Power law type CSD.
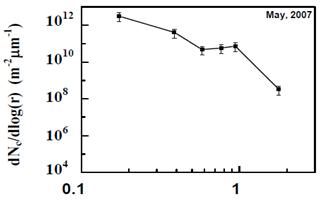
Figure 2: Bimodal (mixture of power-law type and lognormal) type CSD.
The results suggest an enhanced loading of coarse mode (natural origin) particles, which could be associated with an enhanced local activity such as wind-blown dust during April to June over this site. The CSDs during September to March fall under power-law type distribution followed by bimodal type from April to June in the radius range used in the present study. This feature is seen more or less every year. The distributions for April, May and June clearly show bimodal characteristics indicating the presence of both marine and land aerosols. The retrieved CSD generally show a steep fall in columnar number density dNc/dlog(r) i.e., nc(r) with increase in r from 0.1 μm (at the lower particle size; depicting an inverse power law type dependence), followed by a well defined secondary mode (coarse particle; depicting a unimodal type distribution). At further coarser mode, the number density nc(r) decreases again with r. This is also physically justified as the number density cannot increase indefinitely because of the processes such as coagulation, which limits the concentration of the sub micron aerosols. This leads to the formation of an accumulation mode aerosols (Hoppel et al., 1990), by rapid transformation of nucleation mode aerosols to the accumulation (fine) ones. It has been observed that 9 CSDs (April to June 2005-07) out of all these retrieved CSDs can be analytically represented by a combination of power law and unimodal log normal distribution in the optically active size range and remaining 21 CSDs (September to March 2005-08) can be represented by power law types. With a view to examine the changes in columnar properties associated with the monthly changes in spectral AOD, the effective radius (Reff) of aerosols has been determined. The effective radius of a polydispersive aerosol system is equivalent to the radius required for a monodisperse aerosol to exhibit the same total scattering characteristics as polydispersion (Mc Cartney, 1976). The monthly variations of the Reff with standard error bar are shown in Figure 3
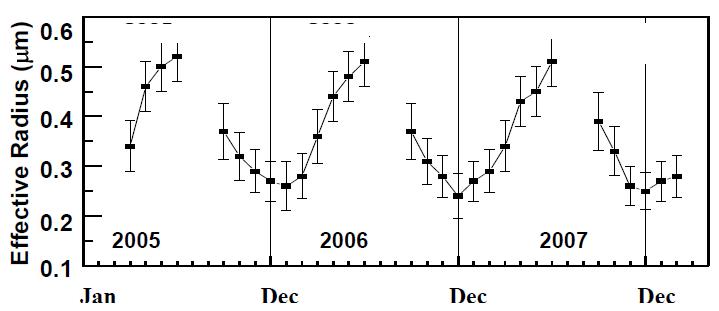
Figure 3: Monthly variation of Effective Radius
Systematic seasonal pattern is seen in Reff. In the month of May–June, the value of Reff is high (~0.5 μm) and low (~0.25 μm) during December-January as expected. The variability in the value of Reff is either larger or comparable to those seen in other Months. Reddy et al., (2007) reported that the Reff remains around a low value (0.12 to 0.14 μm) till the end of May and starts increasing from June onwards at Anantapur (Andhra Pradesh). It reaches the peak value (~0.45 μm) by the month of August with higher seasonal wind over Anantapur during 2005.
Discussion
The aerosol columnar size distributions retrieved for different months show consistent power-law type during September to March and bimodal characteristics during April to June months. The wavelength dependency of AOD depicts a positive curvature towards the longer wavelength in the case of the bimodal nature of the size distribution during April to June. The two modes can be attributed to two different production mechanisms, with the primary fine mode attributed to aged aerosols from secondary production processes while the secondary large particle mode appears to be associated with coarse marine aerosols. The coarse mode is generally occurring at a value of r > 0.5 μm, whereas the fine mode is not occurring below the value of r < 0.1 μm, lower than the lower limit considered in the inversion technique. The occurrence of such mode suggests the presence of large abundance of nucleation (r~0.001 to 0.1 μm) or accumulation (r~0.1 to 1.0 μm) mode aerosols over the site. The occurrence of such mode is to be expected as the location is urban, low altitude station lying in the central part of Saurashtra and away from the strong sources of aerosol production. As the size spectrum is indicative of the particular source and sink of aerosols to which each mode can be attributed, the bimodal nature of CSDs suggests two different sources of aerosols. However, the peak height of the accumulation mode is almost 2 - to - 3 orders of magnitude less than that of the fine mode. Jaenicke (1984) and Hoppel et al. (1990) have suggested that the two modes observed in the CSDs are attributed mainly to two different production mechanisms: gas-to-particle conversion (GPC) and bulk-to-particle conversion (BPC) respectively. The primary small mode is attributed to the aged aerosols from the secondary GPC processes or phase reaction products as well as associated with the human activity on the landmass (Ramanathan et al., 2001). The GPC gives rise to particles size of the order of radius < 0.5 μm, while the BPC gives rise to the coarse mode particles of the order of radius >0.5 μm. After the production, the fine particles (r~0.1μm) of the size distribution are controlled mainly by the coagulation and condensation processes whereas the coarse mode particles (r > 0.5 μm) are mainly controlled by sedimentation (Pruppacher and Klett, 1978) and impaction scavenging processes. The nature of the size distribution between these radii limits reflects the aerosol sources, sinks and the aerosol transport, which have regional importance. Near the aerosol source, the aerosol characteristics are well associated to the generation or production mechanism, while it is quite different on a global or synoptic scale, when present at large distances from the source region. Moreover, the various microphysical processes bring out the continuous size transformations which are quite important in limiting the concentration of fine mode aerosols. The appearance of bimodal nature of CSDs is indicative of additional sources which are responsible for secondary mode aerosols. As the observational site is away from the major industrial or anthropogenic activities, the observed changes in the CSDs are brought in terms of either natural sources and sinks or other long range transport mechanisms. The long range transport is capable of bringing large amount of desert and mineral aerosols from the west Asian and the Great Indian Desert (Kuchh is situated in north-west of Rajkot) to the site and is responsible for the generation of secondary mode during the study period over the site. In addition to the advection by air masses, the increased solar heating of the rocky area surrounding the measurement site during the summer season would result in the increased convection activity and the evolution of the atmospheric boundary layer (ABL) during daytime will cause lifting of the aerosols and pollutants to the higher altitudes. Hence the columnar content as well as the mass loading is increased during the summer seasons.
Conclusion
From the above discussion we conclude that
- The ambient air over Rajkot is not highly polluted in comparison to that of any densely polluted cities of India.
- The bimodal distributions in April to June suggest that during this period mixed aerosols (dust driven, marine as well as local and transported aerosols) are present in the air.
- During September to March most of the days have pristine environment over here that is fine mode particles are dominant as the columnar size distribution over here shows power-law type (In this post-monsoon season, there is washout of coarse mode particles from the atmosphere and there is no dust aerosol loading in to the atmosphere due to local production).
- There is an increase in the effective radius and columnar aerosol mass loading from January to June, attributed to the increase in the relative dominance of coarse mode aerosols in the size spectrum during April to June.
- Decreasing value of the effective radius from September to December indicates the reduction of coarse mode aerosols from the atmosphere.
Acknowledgement
This work was carried out as a part of Indian Space Research Organization, Geosphere Biosphere Program.
REFERENCES :
***************************************************
Ritweej Rajeev Ranjan
N. H. Manani
H.P. Joshi
K.N. Iyer
Department of Physics, M.M. science College, Morbi
Department of Physics, M.M. science College, Morbi
Department of Physics, Saurashtra University, Rajkot
Department of Physics, Saurashtra University, Rajkot


Home |
Archive |
Advisory Committee |
Contact us